Sunday, December 19, 2010

The Saudi Arabian SAM Network

INTRODUCTION

The Kingdom of Saudi Arabia contains what is arguably some of the most valuable real estate on the face of the planet. The massive oil reserves have turned Saudi Arabia into an economic powerhouse in the late 20th Century. It should come as no suprise that a portion of the Kingdom's profits were spent on military systems to defend the Kingdom from regional aggressors.

ORGANIZATION

Encompassing a vast amount of relatively barren territory pockmarked by population centers primarily situated along the coastlines, Saudi Arabia employs a point-defense oriented SAM network. The bulk of Saudi Arabia's defensive assets have come from the United States and the United Kingdom via a series of multi-billion dollar weapons contracts.

Air defense assets are controlled by the Royal Saudi Air Defense forces. This service branch was separated from the Saudi Army in 1981, and is headquartered in the capital of Riyadh. The air defense forces operate the EW facilities and strategic SAM systems.

EW NETWORK

Twenty nine EW sites have been identified in Saudi Arabia, four of which were inactive in the most recently available imagery. The primary EW radars are the AN-TPS-43, AN-TPS-63, and AN/TPS-77, most of which were delivered in the 1980s. EW sites are situated along the border of the nation, with multiple sites providing additional coverage of the nation's interior. The only area devoid of significant EW coverage is the barren southeastern region, bordering the UAE and Oman.

The following image depicts the locations of Saudi Arabian EW sites:
PATRIOT

The MIM-104 PAC-2 Patriot represents the most capable strategic SAM system operated by Saudi Arabia. Saudi Arabia initially ordered the Patriot system in 1990, and to date has received a total of twenty one batteries. Saudi Arabia has expressed interest in acquiring the ATBM-optimized PAC-3 ERINT system, but a contract has yet to be signed.

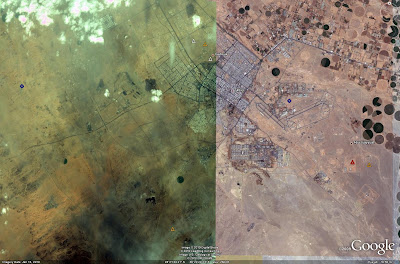
Saudi Arabia currently fields eleven operational Patriot batteries. A total of fifteen Patriot deployment sites have been identified, with four remaining unoccupied in the latest imagery. The majority of Saudi Arabian Patriot batteries are deplyed at prepared, hardened facilities. These facilities feature hardened revetments for the TELs and a raised berm for the AN/MPQ-53 engagement radar.

A Saudi Arabian Patriot site near Dhahran can be seen in the image below:
The locations and coverage zones of Saudi Arabian Patriot batteries can be seen in the image below. Note that the bulk of the systems are consolidated along the northeastern coastline, defending the major oil export facilities and the Dhahran metro area.
HAWK

HAWK missile systems have served in Saudi Arabia since the 1960s. Between the late 1970s and early 1980s, Saudi Arabia received the improved I-HAWK system and re-built ten HAWK batteries to the same standard.

There are currently eighteen active HAWK batteries in Saudi Arabia, with a further six inactive HAWK sites. HAWK batteries are typically deployed to provide close-in air defense for Patriot batteries.

The locations and coverage zones of Saudi Arabian HAWK batteries can be seen in the image below:
CAPABILITIES

Overall Coverage

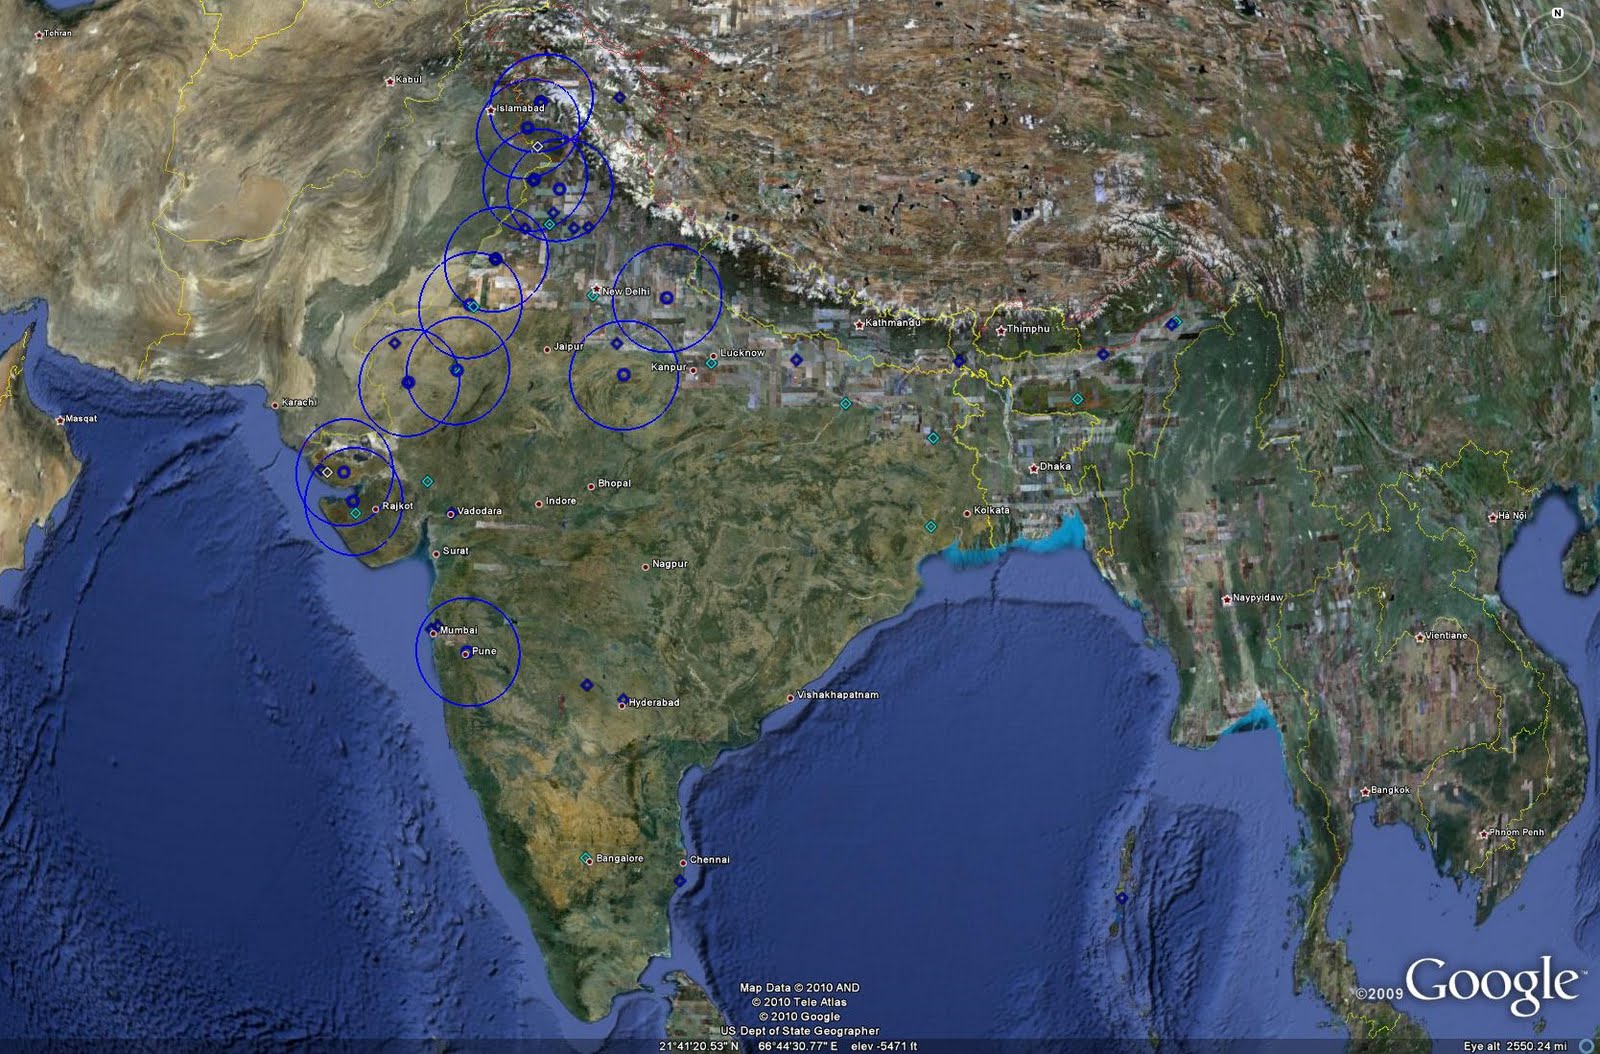
Arrayed in a point-defense layout, the Saudi Arabian strategic SAM network represents a formidable obstacle to any potential aggressor. The Kingdom has deployed strategic SAM systems in a manner designed to defend the most critical locations in the nation. Unsuprisingly, a large concentration of SAM systems are positioned in the northeastern portion of the nation, along the coastline facing Iran.

The following image depicts the nationwide strategic SAM coverage in Saudi Arabia:
Primary Locations

There are five primary SAM concentrations, with each location defended by no fewer than three active batteries. These locations are the capital of Riyadh, the metropilotan areas surrounding Dhahran and Mecca, and the military facilities at King Faisal AB and King Khalid Military Complex. HAWK batteries also protect other locations, such as King Khalid AB.

The following image depicts the deployment of air defense assets near the capital of Riyadh. Note the positioning of an active HAWK battery and an EW facility near the military complex southeast of Riyadh at Al Kharj.
The following image depicts the deployment of air defense assets near the city of Mecca. SAM assets are deployed along the western coastline to provide clearer fields of view for associated radar systems. While the HAWK batteries near the coastline cannot defend the skies directly over Mecca, the Patriot battery can range over both areas, including King Fahd AB to the east, which is also defended by a HAWK battery.
The following image depicts the deplyment of air defense assets near the city of Dhahran:
Given Dhahran's economic importance to the Kingdom, it is defended by the highest concentration of strategic SAM assets found in the nation. These SAM batteries, currently consisting of six active Patriot and four active HAWK batteries, are arrayed to provide overlapping fields of fire throughout the area. The multiple target engagement capability of the Patriot system makes this the best-defended piece of real estate in the entire nation.

The following image depicts the overlapping fields of fire of the deployed Patriot and HAWK batteries near Dhahran:
The following images depict the deployment of air defense assets near King Faisal AB and King Khalid Military Complex, respectively. Each location is defended by multiple SAM batteries.
The Air Element

With a high percentage of Saudi Arabia remaining sparsely populated, the Kingdom also relies on the Royal Saudi Air Force to defend its skies in conjunction with the deployed strategic SAM assets. Current air defense aircraft include the F-15C and EF-2000, with the multi-role F-15S also fully capable of performing the task if required.

Air defense capable aircraft are currently deployed at four locations. A fifth location, Prince Sultan AB near Riyadh, is home to the RSAF's E-3 AWACS fleet. These aircraft can serve as gap fillers in the air defense network's EW system, or can direct air defense aircraft to targets. In the same fashion, the air defense aircraft can serve to defend the Saudi skies unprotected by SAM systems.

The following image depicts the locations where air defense aircraft are based. Red icons indicate the presence of combat aircraft, while the blue icon represents the Saudi E-3 base.
LIMITATIONS

Combining strategic SAM systems and a capable air force ensures that Saudi Arabia is relatively well defended. However, there are certain limitations to the network. Reliance on the aging HAWK SAM system reduces the effectiveness of the network in certain areas, particularly those with the HAWK as the primary defensive system. A potential aggressor such as Iran, with acess to the HAWK in its own inventory, would be well-versed in the capabilities, limitations, and effective counters to the system.

Furthermore, the point-defense layout of the network leaves large portions of the nation undefended by strategic SAM assets. While aircraft can be called upon to defend these areas if required, the presence of large gaps in the nationwide air defense picture leaves numerous vulnerabilities open to exploitation by a foreign aggressor.

CONCLUSION

All things considered, the Saudi Arabian strategic SAM network is logically arrayed to defend key religious, industrial and military locations. With the potential acquisition of the PAC-3, the network will enhance its ability to intercept inbound tactical ballistic missiles, possibly forcing an aggressor to rely on airpower rather than missile strikes alone to engage targets. Considering the strength of the SAM network around likely targets, and the presence of the capable RSAF, this could turn out to be a losing proposition for all but the most capable air arms.

SOURCES

-Satellite imagery provided courtesy of Google Earth

SIPRI

Friday, December 17, 2010

SAM Site Update: How It Works

Given that the SAM Site Overview update took a while to process this month, I thought I'd explain how it works.

During the course of a given month, I am always looking for new and interesting locations to include in the file. Many of the new locations are also provided by IMINT & Analysis readers, whose help is always appreciated! I file these new sites away in a folder, and generate any necessary range rings. They also get added to an Excel spreadsheet which compiles all of the inventory numbers you see when you click on the Continent or Country folders. When Google Earth updates its imagery, which typically happens twice a month these days, they also release a .kmz file which outlines the new imagery. The .kmz file usually follows the imagery update by two or three days. When I get these files, I go through and check existing locations to see what has changed. Things I look for include active sites becoming inactive, and a change in site equipment. For example, the current update features a Chinese S-300PMU-2 site, which was formerly occupied by an S-300PMU-1 battery.

All of this takes a little bit of time, but is relatively straightforward and uncomplicated. The problem this month was a delay in Google Earth releasing the .kmz file of the latest imagery update. I wanted to wait until it was available to get the most accurate product out, especially since I figure that they may not do another update this year due to the holidays.

So, now you know how it works! And hopefully you can see that the delay this time was really a technical issue, and not another example of my outstanding ability to procrastinate.

Speaking of which, yes, the Saudi Arabia feature will still be posted tomorrow!

Image of the Week: Kadena Raptors

OKINAWA RAPTORS
The image above depicts six F-22As from the 27th FS, 1st FW at Langley AFB, Virginia. The Raptors were deployed to Kadena AB, Okinawa for a 120-day theater security deployment over the first quarter of 2010. The Raptors imaged above are seen prior to departure from Kadena, as evidenced by the presence of external fuel tanks carried for long-range travel. The external fuel tanks are often used to support deployments. They have also been noted underwing of Alaska-based F-22s performing intercept missions against Russian strategic bombers, likely providing an additional fuel reserve for overwater sorties.

ADDITIONAL DISCUSSION

Feel free to discuss the current Image of the Week at the IMINT & Analysis Forum Image of the Week discussion thread found here.

SOURCES

-Satellite imagery provided courtesy of Google Earth

Saturday, December 4, 2010

December Schedule

Here's the current theoretical December schedule:

Week 1: SAM Site Overview update (late next week, after the next Google Earth imagery update)
Week 2: Saudi Arabia's SAM network
Week 3/4: update to China's 2nd Artillery; I'll be gone for part of the time for the holidays, so only one update over this week.

I'll also be gone the first week of January, so the January schedule will also be slightly altered, with the SAM Site Overview update being posted during the second week along with a yet-to-be-decided SAM Network analysis piece.

Image of the Week: Rafales

LANDIVISIAU RAFALES
The image above depicts the ramp space at Landivisiau AB in northwestern France, occupied by two Rafale M multirole fighters. Landivisiau is located close to Brest, home to one of the French Navy's major port facilities (and France's SSBN base). Landivisiau serves as the land-based home to the French Navy's carrier-based combat aviation units, with three squadrons of fighter aircraft in residence. Two of these units operate the Super Etendard Modernise, with the third operating the Rafale M. The Rafale series, including variants operated by the French Air Force, represents one of the more advanced 4+ generation combat aircraft currently in service. Current plans call for the replacement of the Super Etendard with further examples of the Rafale in the 2015 timeframe. At sea, the French Navy's Rafale M sqaudron operates from the nuclear-powered aircraft carrier (CVN) Charles de Gaulle, and the aircraft have seen operational service as part of the NATO mission over Afghanistan.

ADDITIONAL DISCUSSION

Feel free to discuss the current Image of the Week at the IMINT & Analysis Forum Image of the Week discussion thread found here.

SOURCES

-Satellite imagery provided courtesy of Google Earth

Tuesday, November 16, 2010

Sidetracked

Sorry for the lack of activity over the past few weeks, I've been sidetracked with a lot of stuff to do. I teach, and I'm working on a third degree, and so I got a bit buried for a bit there. Everything is OK now though, so we're back to something resembling normal activity. My plan for the rest of the month is to get back to the Images of the Week, update the SAM Site Overview, and probably drop an article or two. Then I'll return to business as usual in December with a posted schedule and all that. Anyway, back to work.

Sunday, September 12, 2010

The Indian SAM Network

INTRODUCTION

One of the most populous nations in the world, India has engaged in numerous regional conflicts in the past. The threat environment led to the creation of a point-defense oriented EW and SAM network designed not to protect the skies over India, but to protect the military units tasked with such a role. This ultimately led to the creation of a number of EW and SAM units within the Indian Air Force.

OVERVIEW

Indian air defense elements, to include EW assets, SAM systems, and interceptors, are subordinate to the Indian Air Force (IAF). This allows the IAF to coordinate both sensors and weapons, allowing for a maximum degree of target deconfliction. SAM units are organized as squadrons, with radar units being organized as either signal units or transportable radar units, depending on the assigned types. These units are in turn subordinate to the five operational commands in the IAF.

The Indian SAM network follows a point defense layout. The primary SAM system employed by the IAF is the S-125M (SA-3B GOA). These systems are deployed at various airbases in the northern and western portions of India. EW assets are deployed primarily along border regions, with the highest concentration being present along the northern and western borders with Pakistan.

EW ASSETS

Fifty four EW sites have been identified in India. The primary assets are THD-1955, P-12/18 (SPOON REST), and 36D6 (TIN SHIELD) radars. Thirteen THD-1955 radars arrayed primarily along the border region from Pakistan to Myanmar provide a significant amount of EW coverage. EW coverage is enhanced by fourteen 36D6 radar sites, arrayed primarily along the border with Pakistan. The 36D6 is significant as it can provide both target track data to SAM batteries as well as GCI support for Russian-origin fighter aircraft such as the MiG-29 (FULCRUM) or Su-30MKI (FLANKER-H). P-12/18 radar sites are scattered throughout the region, as are indigenous Indra-II radar units. The net result is an EW network that is heavily oriented towards potential threats.

The following image depicts the locations of identified Indian EW facilities. Dark blue diamonds represent basic EW sites, typically manned by P-12/18 or Indra-II radar systems, while light blue diamonds represent THD-1955 radar facilities. Blue circles represent 36D6 radar facilities. The range rings given for the 36D6 sites represent the 165 km acquisition range against a typical fighter-size target. Each radar system is capable of target detection at greater ranges depending on the target RCS and altitude, with the THD-1955 typically employing a range of 400 km.
The following image depicts a typical THD-1955 site. These large radars are sited atop dedicated structures. This site is located south of Shillong in eastern India.
The following image depicts a deployed 36D6 radar at Pune AB in western India. This radar likely serves as both an EW and GCI asset, given its co-location with Su-30MKI fighters.
India does possess the 40V6 series of masts for mounting the 36D6, although their use appears to be relatively infrequent. The following image from February 2008 depicts a 36D6 mounted atop a 40V6 mast assembly at Nal AB. Imagery captured four months later indicates that the 36D6 is still deployed but has been removed from the 40V6. Only thee 36D6 locations have an identifiable 40V6 series mast available for use.
Other EW assets include the A-50I AWACS based at Agra AB, and potentially an aerostat system found near the border with Pakistan. The aerostat system's purpose is unknown at this time, but could potentially be used to mount an air surveillance system. The facility can be seen in the image below.
THE S-125

India's primary strategic SAM system is the S-125M. These systems were delivered between 1973 and 1989 from the USSR, and thirty four batteries are currently active. These batteries provide point defense for key military installations, typically airbases, in the northern and western portions of India.

The locations of India's active S-125M batteries and their engagement zones can be seen in the image below:
The S-125M has two specific drawbacks: range and single-target engagement capability. The ability of the system to engage one target per battery is partially mitigated by placing multiple batteries at many locations, but the 25 km maximum range of the system effectively reduces its role to one of point defense only, lacking the range to provide long-range overlapping fields of fire necessary for a more robust air defense network.

IAF S-125M batteries are frequently relocated in their operating areas. This can be done to complicate targeting by enemy assets and to allow systems to be cycled through maintenance periods. The following image depicts the S-125M deployment area at Vadodara AB in western India. While only one location currently has an active battery, there are four other locations which have been active at some point in the past.
Numbering the S-125M locations 1 through 5 from west to east, the following information can be derived from available imagery:

Site 1
-Active from December 2005 to March 2010

Site 2
-Active from October 2000 to October 2002
-Active from June 2003 to November 2003
-Active from December 2003 to March 2010

Site 3
-Active from October 2000 to October 2002

Site 4
-Active from November 2003 to December 2005
-Currently active as of March 2010

Site 5
-Active from June 2003 to March 2010

All told, there are twenty one inactive or former S-125M positions identified throughout India that can be used as relocation sites should the need arise.

TACTICAL SYSTEMS

Tactical SAM systems are also operated as point defense assets in the IAF. The primary system is the Osa-AKM (SA-8 GECKO), a mobile system mounted on a wheeled TELAR. The 10 km range of the system allows it to serve as a layered short-range counterpart to co-located S-125M batteries.

An IAF Osa-AKM TELAR can be seen in-garrison near Ambala AB in the image below.
The Indian Army operates the 2K12 Kvadrat (SA-6 GAINFUL), which could be employed in a similar capacity to IAF Osa-AKM units if required. The Army also operates additional Osa-AKM units.

LIMITATIONS

Given that India has chosen to rely on a point-defense oriented air defense network, the lack of long-range SAM coverage is not a true limitation. Furthermore, the presence of significant numbers of fighter aircraft such as the Su-30MKI cpaable of acting in concert with the EW network to perform interception tasks can alleviate the lack of long-range SAM coverage. However, there are still some limitations to be addressed within the network as it is currently organized.

The primary limitation is one of terrain. Northern and eastern India contains very varied terrain, which can introduce significant blind spots in radar or SAM coverage, reducing the network's effectiveness. The issue of EW coverage has been addressed to a degree by the procurement of the A-50I AWACS platform.

The other significant limitation faced by the strategic SAM network is one of age. While many of the systems have been refurbished or modified to retain their effectiveness, the age of the systems is such that a potential aggressor has enjoyed a significant amount of time to discern weaknesses and develop ECM systems and countertactics to defeat the deployed systems. In truth, it is the age of many of these systems that has pushed India towards developing and procuring new SAM systems to replace the elderly systems currently in widespread use.

ABM DEVELOPMENTS

One significant aspect of Indian air defense that will become operational in the near future is an ABM capability. India began researching an ABM system in 1999, with the goal of fielding a two-tier system. The two-tier system would consist of the exoatmospheric PAD, a Prithvi SRBM derivative, and the endoatmospheric AAD. Where PAD employs a directional warhead, AAD employs a hit-to-kill kinetic warhead. It is now believed that a new weapon referred to as PDV will replace the PAD in the two-tier structure. This system is capable of engaging 1500 km range ballistic missiles, making it an ATBM rather than a true ABM system, but a separate system with a design goal of engaging 5000 km range weapons is underway to field a true ABM.

The radar syste employed by the PAD/AAD weapons is referred to as Swordfish and is in actuality a modified Israeli EL/M-2080 Green Pine radar system. Two of these radars were delivered to India in 2002. One is currently sited northeast of Bangalore, with the second being located near Konark on India's northeast coast. The radars are sited in protective domes. The inland facility can be seen in the image below:
FUTURE PROSPECTS

India is actively developing and acquiring new SAM systems to revitalize its air defense force for the 21st Century. There are three significant programs which should begin to bear fruit in the near term. The first is the Akash, being procured by the IAF to potentially replace S-125M systems. This is an indigenous mobile SAM system derived in part from the 2K12. Maitri is a short-range SAM being co-developed with France, employing technology used in the French Mica BVR AAM. The third program is a long-range SAM system. This system may build upon the aforementioned AAD weapon under the codename of Ashvin. Deployment of these weapon systems will eventually allow the IAF to retire the S-125M and Osa-AKM, replacing them with weapons more capable of performing effectively in the current environment.

CONCLUSION

While India's SAM network does not appear to be particularly robust or capable on paper, it is not intended to serve as the primary protector of the nation's airspace. However, even with its more limited role, modernization programs must continue if the network is to remain viable in the forseeable future.

SOURCES

-Satellite imagery provided courtesy of Google Earth

IAF Orbat
SIPRI
PAD Test

Monday, September 6, 2010

Does All of Our Intelligence Data Pass The "So What" Test?

Data relevance is critical to achieving success in the Intelligence Community (IC). Simply put, everything that we do must pass the “so what?” test, and we need to move away from creating intelligence data for intelligence’ sake. This means that every intelligence product and briefing should have a clear goal and tangible outcomes.

The unfortunate reality is that many of the IC’s efforts do not come close to passing this test. All too often, our intelligence lacks relevance or does not tangibly support a mission. The main issue is a lack of insight into goals based on achieving measurable outcomes.

The following is an example of viable intelligence that would clearly pass the “so what?” test based on tangible outcomes. Imagine that we have identified and then targeted a Taliban kidnapping ringleader, and our intel products/briefings make the argument that we have this terrorist's pattern of life and furthermore, by removing him, we will halt kidnappings in this region for a three-month period. This provides our Commander with a clear “so what?” This intelligence matters. Our Commander and staff, primarily his Operations Officer, are able to analyze the means available to them and formulate an appropriate plan to intervene. By collecting and providing the data needed to remove this leader, the key outcome is the fact that kidnappings decrease in this region. The goal of this mission was to decrease kidnappings and make this region safer, so the outcome was achieved.

From a terrain perspective, many analysts provide data about the slope, vegetation, hydrography, cover and concealment, and location of roads that could play a major role in determining the ideal location of the enemy’s SCUD launchers and associated support vehicles. The “so what?” factor is that by correctly analyzing, interpreting, combining with other intelligence disciplines, and then disseminating this data, we can predict likely SCUD locations. Similar analysis can offer Primary, Alternate, and Supplementary positions for our own Field Artillery units or ideal Drop Zones and Helicopter Landing Zones.

These examples of providing actionable intelligence seem very intuitive, and one would expect these types of efforts to be commonplace. Unfortunately, they are not all that common. One of the driving issues behind this challenge is the myriad of available data.

In 2009, unmanned aerial vehicles (UAVs) alone generated 24 years worth of video if watched continuously. In 2010, UAVs are expected to generate 30 times that amount of data—and military commanders are acknowledging the issue. According to Lt. Gen. David A. Deptula, U.S. Air Force Deputy Chief of Staff for Intelligence, Surveillance, and Reconnaissance, “We are going to find ourselves in the not-too-distant future swimming in sensors and drowning in data.” (1)

The other challenge is focusing only on relevant data. For example, many believe that the IC is only marginally relevant to the overall strategy in Afghanistan because the majority of our collection efforts and analytical prowess are focused on insurgent groups. As such, our vast intelligence apparatus still finds itself unable to answer fundamental questions about the environment in which we operate and the people we are trying to persuade. (2)

The “so what?” factor in Afghanistan is determining who the local powerbrokers are that need to be influenced, as well as how we can best engage with locals—whether they are villagers, aid workers, or Afghan soldiers—to gain the credible insights we need to help advance the mission. (2)

Now that he has been appointed the new Director of National Intelligence, one of the key challenges that retired Lt. Gen. James R. Clapper Jr. hopes to tackle is to unite the traditionally separate missions of intelligence collection and analysis and to shrink and flatten the intelligence bureaucracy. (3) Clapper has also created the position of Deputy Director for Intelligence Integration to unify the collection and analysis tasks, which is a significant step toward addressing this issue. (4)

It certainly seems that IC leaders are taking this issue very seriously, and a top-down effort could bring about true change. However, all levels of the IC must continually ask themselves “so what?” If they are unable to answer this question, their efforts may be wasting the time and resources of our troops and policymakers—and these are resources that we cannot afford to waste.

-Lt. Col. (Ret.) Marv Gordner, 2010

REFERENCES

(1) “Too Much Information: Taming the UAV Data Explosion,” Defense Industry Daily, May 16, 2010
(2) Greg Dunlap, “Fixing Intel: A Blueprint for Making Intelligence Relevant in Afghanistan,” Marine Corps Gazette, December 9, 2009
(3) Ellen Nakashima, “New Intelligence Chief Clapper Brings Sense of Humor to Serious Job,” The Washington Post, August 21, 2010
(4) Pam Benson, “Director of National Intelligence Names Deputy to Boost Collaboration,” CNN, August 20, 2010

ABOUT THE AUTHOR

The preceeding article was written for this site by Lt. Col. (Ret.) Marv Gordner, a former intelligence officer in the US Army. Mr. Gordner has twenty-one years of extensive leadership and management experience in the Department of Defense and intelligence collection field. His assignments included the 101st Airborne Division and Special Operations Forces including, 5th Special Forces, 3d Special Forces, and the Joint Special Operations Command (JSOC). He now serves as the Program Manager, Intelligence Solutions Division, for MorganFranklin.

Saturday, September 4, 2010

Some news items

Before I get to updating the SAM Site Overview file, here's a few news bits that I either forgot to mention previously, or that are new.

-I have invaded Facebook. Not sure if this is relevant at all, but you can add me if you want. I use the same image as my profile picture here, the MiG-29 Guards badge. Don't know yet if anything amusing or relevant will come out of it, but you can always watch me harass my former coworkers if you want!

-Over the past few months I've been contributing features to Air Power Australia. These are either relevant reworks of features found here, or specialized things like the PLA BM summary that may or may not have worked for this site. So, go to APA and see what you can find if you're interested.

-Monday will see the publication of the first guest-written article here. The author, Lt. Col. (Ret.) Marv Gordner, is a former Army intel officer with an extensive SOF background. I'll post a fuller bio with his article, which covers whether or not intelligence collection has both a goal and serves a requirement. Given the quality of Lt. Col. Gordner's piece, this is something that I will certainly be open to more of in the future. So if any of you have amusing ideas and are looking for someplace to get some exposure, send me an e-mail.

Wednesday, September 1, 2010

September Schedule

Here's the projected lineup for September:

Week 1: SAM Site Overview
Week 2: India's SAM Network
Week 3: Iranian BM Facilities
Week 4: China's SAM Network update

Yeah, the China thing keeps getting pushed back. Turns out it needed a very deep update and reformatting, and with starting class and resuming teaching for the fall semester free time has not been very easy to come by recently. But it's still working, and if I get it done early I'll post it and update something else for Week 4.

Sunday, August 22, 2010

New PLAN Airfield Identified

PROBABLE NAVAL AVIATION BASE IDENTIFIED
The image above depicts a new airfield located 28 kilometers southwest of Huludao in northeastern China. This airfield was constructed between April 2009 and June of 2010. The June 2010 imagery shown indicates that many of the structures and airstrips are still being completed, but the overall layout of the airfield is in place.

This airfield is likely a PLAN facility, and may represent the first facility destined to house the PLAN's J-15 carrier-based fighter. The J-15 is a Chinese-produced Su-27K (FLANKER-D) derivative. Photographs of the first prototype currently undergoing flight tests indicate that the aircraft is a derivative of the Chinese-produced J-11B, a modified Su-27SK featuring Chinese avionics, weapons and engines. The J-15 features the canard foreplanes and short tail sting of the Russian Su-27K, but possesses the modified radome and modified wingtip missile rails only found on the J-11B. At this time the J-15 prototype apepars to retain Russian Al-31F engines, but may be fitted with the indigenous WS10 in the future. Alternatively, as the Al-31F is a proven naval aviation powerplant, production J-15s may retain this engine.

Carrier aviation affiliation is denoted by the presence of what appears to be a ski-jump takeoff ramp, similar to that seen at Xian, being constructed adjacent to the main runway. Another potential naval-related feature is a possible mock landing area located near the north end of the main runway. Such a feature allows carrier pilots to practice mock approaches while operating from land. What appear to be foundations for 24 individual aircraft shelters may provide a glimpse into the size of a PLAN J-15 unit, suggesting that an operational airwing may be composed of either 12 or 24 fighters.

Constructing this airfield in the northeast may suggest that Huludao will be fabricating the PLAN's indigenous aircraft carrier. Another option is that the base provides access to the sheltered waters of the Bohai Gulf for overwater training flights, allowing the airwing to be produced and worked-up prior to an eventual training deployment on the refurbished Varyag. Varyag has recently left the dock at Dalian and is possibly in the final stages of outfitting prior to beginning sea trials for the PLAN. Given the amount of work that visibly remaisn to be completed on the Varyag, sea trials are likely no earlier than sometime in late 2011.

The location of the base indicates that the assigned aircraft, should this represent an operational unit, will be assigned to the North Sea Fleet. This would seem to indicate that either the Varyag or a Chinese-produced aircraft carrier will also serve in the North Sea Fleet. The limited amount of aircraft shelters being constructed also indicates that the PLAN is not following the USN model, whereby few large airbases host various carrier aviation units. This suggests that if more than 24 J-15s are to be produced to equip carrier air wings, they will be based at a different location. Identifying the locations where these bases are constructed will provide further insight into China's plans for its carrier force, such as which fleets the vessels will serve with.

A further possibility is that PLAN flight testing is simply being separated from the activity at Xian. In the near future Xian will be testing a new transport aircraft, the XXJ fifth-generation fighter, various UAVs, and other aircraft types. Separating test and training activity for the PLAN to a new facility would serve to alleviate some of the potential crowding at Xian which may occur. Were this to be the case, then the previously mentioned assertions as to the basing, airwing size, etc would no longer be valid.

As China's naval aviation force expands into carrier-based aviation, the identification of facilities such as this will become important in deriving the changing intentions and force strengths of the PLAN. IMINT & Analysis will continue to monitor these locations with a goal of deriving any useful information.

SOURCE

-Satellite imagery provided courtesy of Google Earth

Friday, August 20, 2010

Google Earth & Law Enforcement

INTRODUCTION

GIS programs like Google Earth offer a lot of capabilities that can be exploited by various professional agencies. Access to overhead imagery, three dimensional environments, and the ability to edit and distribute information through the program make Google Earth in particular a useful analytical tool. One potential use for the program which seems to be underutilized is in the realm of law enforcement. While Google Earth is not a real-time imagery browser, a number of the capabilities it offers can enhance the performance of law enforcement functions.

This article represents a sanitized and reduced-scope version of a professional training tool developed by the author for a client in the Southwestern United States. It is intended to provide a basic overview of some of the capabilities of Google Earth valuable to law enforcement agencies and brief descriptions of how they can be effectively exploited.

AREA EXPLOITATION

One of the most obvious aspects of Google Earth that can be exploited is the ability to analyze the local environment. This can be of critical importance to any law enforcement agency planning surveillance or an offensive operation in a potentially unfamiliar area. While traditional maps and charts can offer a degree of understanding, Google Earth offers a far more robust set of features for extracting data.

Layout

The overhead nature of Google Earth provides an excellent medium for analyzing the layout of a given area, be it an urban, rural, or uninhabited location. Simply navigating to a point of interest provides the user with a significant amount of information. The status bar along the botom of the screen provides, from left to right, the date the imagery was acquired, the coordinates, the elevation, and the eye altitude.

The imagery capture date is significant as it allows the user to put the image in context. An older image may not show current features such as roads or buildings. Alternatively historical imagery can be browsed to view changes to the area that have been made over time.

The coordinates and elevation data are directly tied to the position of the on-screen cursor. As the cursor is moved around the screen, the coordinates and elevation data will change to account for the current position.

The eye altitude is the apparent position of the viewer above the image. For example, an eye altitude of 5,000 feet indicates that the image is what would be seen by an observer 5,000 feet above ground level.

Once an area of interest has been located, various features can be viewed by selecting different options in the Layers menu found at the bottom left of the screen. Some relevant features include roads, which will bring up the paths and names of various roads in an area, and other locations such as restaurants, bars, hospitals, water features, and terrain.

The following image depicts Nogales, Arizona, with the roads feature activated. Notice how both the pathways and names of the roads are overlaid on the overhead imagery.
Examining Terrain

Google Earth provides many ways to view the environment in three dimensions. The most common involves viewing the terrain in a given area. By selecting the terrain feature in the Layers menu, three dimensional terrain is loaded into the image.

Terrain data can also be manipulated to exaggerate features, making them more apparent to the observer. In the Options menu, accessed through the Tools section of the taskbar at the top of the screen, a number from 0.5 to 3 can be entered for Elevation Exaggeration. The default value is 1, which displays terrain at the natural scale.

Once terrain features are activated, pressing and holding the mouse wheel will bring up a special cursor on the screen. Pulling back on the mouse will tilt the image allowing terrain to be viewed in 3D. Pushing forward will then return the image to its traditional overhead state.

Consider the following two images, both depicting the terrain north of Tuscon, Arizona. Both images show the same approximate areas. The first image depicts the terrain with an elevation exaggeration value of 1, while the second image depicts the terrain with an elevation exaggeration value of 3. Notice how the features in the second image are greatly exaggerated to bring out their details.

Cities in 3D

3D buildings are available for many major metropolitan areas in Google Earth. These buildings are available in two formats, basic greyscale shapes and photorealistic structures. Greyscale shapes approximate the basic shapes of the buildings they represent, while the photorealistic versions have digital photographs applied to their surfaces to provide a more realsitic approximation of the structures.

3D buildings are accessed in the Layers menu, with the option for loading either grayscale, photorealistic, or both types of buildings available. These structures are created by Google and its user community using a program called Google Sketchup. Buildings are submitted to Google for inclusion into the database, which ensures that the most accurate structures are incorporated and are properly aligned with the imagery. Users can also create their own structures and access them locally.

Phoenix, Arizona provides a suitable environment for examining both types of 3D structures available. In this case, as is the case with many locations, downtown Phoenix is primarily populated with photorealistic buildings, with the outlying areas relying primarily on greyscale structures.

The image below illustrates a residential area northwest of downlown Phoenix. This area has been constructed using greyscale buildings.
The image below illustrates downtown Phoenix. The area has been rendered using photorealistic structures for added detail. Note how segments of the overhead imagery for Phoenix has been incorporated into the buildings for additional effect, including the imagery of a tennis court atop the lower level of the Ernst & Young complex.
The following image depicts a location in Phoenix where both types of building can be seen.
Uses

The various layout features of Google Earth lend themselves to a wide variety of law enforcemnt applications. Traditional activities such as foot or vehicle patrol routes can be planned to maximize the coverage available, ensuring that high interest areas are given the required amount of attention. Routes to and from locations of interest can be evaluated. By using the roads feature, any route can be properly planned, including those through areas or to locations which are not well known.

Apart from the basic features, having a three dimensional environment to exploit is a very useful tool. The most obvious advantage conferred by a three dimensional environment is the ability to evaluate fields of view from various positions. When planning an approach to a given location, for example, a three dimensional environment allows law enforcement officials to evaluate the most unobtrusive approach to a given location, taking the greatest advantage of surrounding structures or terrain. Likewise, in a situation where sniper support or some other form of overwatch is required, a three dimensional environment can be used to evaluate the most advantageous deployment locations for these assets, maximizing their fields of view of the area of interest with regard to other obstructions in the area.

Consider the following example. In this instance, assume that the point of interest is a location to which police must be dispatched to deal with a developing situation. In an encounter such as this, success is often related to the ability to arrive with enough stealth to apprehend most or all of the individuals involved. Having a three dimensional view of the environment can be a significant asset in planning the proper route of approach.

In the first image, it can clearly be seen that a direct approach from the north is undesirable. The parking lot of the building across the street provides a clear field of view from the POI to identify any approaching units.
Likewise, an approach from the west may not be desirable. The following image illustrates that even with the building across the street to the west from the POI, the main street leading to the intersection can be monitored to a degree.
Approaching from the east and taking a less direct route can afford the greatest element of suprise. The building directly adjacent to the POI, combined with the large structures across the street to the northeast, can be used to mask the majority of any approach, as seen in the image below.
In this case, the route of approach can be seen in an overhead view in the image below.
Other routes can certainly prove as or more effective, particularly from the south, but this example illustrates how a three dimensional environment can be significantly useful in developing effective strategies.

The eye altitude information can be exploited to enhance helicopter support for organizations possessing these assets. Recall that the eye altitude represents the position of the observer above the image. This data can be used to set altitudes for helicopter assets to ensure that they are able to effectively monitor a given area. Attention should be given to the calibration of the altimeters in the helicopters. Most altimeters are calibrated to sea level. In this case, the correct altitude would be a combination of the eye altitude and the elevation. If the desired eye altitude is 5,000 feet and the local elevation is 1,000 feet, then the distance above sea level of the patrol should be reported as an altitude of 6,000 feet.

DATA INCORPORATION

Having a tool such as Google Earth to evaluate the layout of a given location can certainly enhance law enforcement activities, but where Google Earth becomes truly valuable is when user-generated data is incorporated into the program. This allows for a host of data analysis techniques to be applied. Data is entered into Google Earth using various annotations which can appear on-screen. These include placemarks, paths, polygon shapes, and external images.

Placemarks

The most effective way to incorporate data into Google Earth is by developing a set of placemarks. Placemarks appear on-screen and can be configured to display relevant details when clicked, providing a useful distribution medium for this information. It is important to develop an effective method of cataloging and detailing placemark files to ensure that they provide clear, concise information.

The following image depicts a portion of Phoenix displaying various placemarks denoting law enforcement activity. In this example, three different placemarks have been used. The blue vehicle denotes action by a patrol car, the orange silhouette denotes action by an office on foot, and the red triangle denotes hostile activity.
When clicked, each placemark will bring up a window such as the one seen in the image below.
In this case, the placemark has been filled with data according to the following template:

Activity
Arresting Officer (AO)
Date
Time
Location
Details
Report

This allows any user to access the relevant data about the incident in question noted by the palcemark. There is also a location to incorporate a weblink to any relevant paperwork or reporting on the incident, allowing it to be quickly accessed.

The formatting and content of the information on display can be managed locally but should always employ the same basic template for ease of use. In this example, clicking on any of the placemarks in the image above would result in the same window being displayed, the only difference being in the information contained therein.

To add information to a placemark, one simply edits the Edit Placemark box which is displayed when a placemark is first added to Google Earth. To edit the placemark after it is entered, simply right click on it and select Properties to bring up the same Edit Placemark box.

The previous examples were generated by simply copying and pasting the basic template into the dialog box and filling in the relevant details. To unclutter the screen, the placemark labels have their opacity set to zero in the Edit Placemark dialog box. This hides any text and only displays the icons. It does not affect the displaying of the relevant data when the placemarks are clicked in Google Earth. Leaving the label opacity set to the default of 100% will result in the placemark name being displayed adjacent to the placemark. When a large number of placemarks are displayed on-screen, this can make for a very cluttered environment.

It should be noted that the dialog box is HTML compatible, allowing the text to be highlighted or otherwise edited. However, due to this fact it is necessary to incorporate "br" following each line of text to denote a break or to simulate hitting the return key. The quotation marks should be replaced with < or > on either side of the "br", but this cannot be effectively shown here due to formatting restrictions.

If desired, there are resources available which can be used to develop a unique set of placemarks if those found in Google Earth do not represent the best method of display.

Placemarks can be organized using the My Places section of the Places menu at the left of the screen. By right clicking on My Places, Add Folder can be selected, allowing the user to add a named folder to store placemarks. Likewise, subfolders can be added for further organization. In this case, the placemarks have been stored in a folder titled Precinct 117, in a subfolder for Arrests. This subfolder is then divided into July and August 2010 subfolders. By selecting or deselecting various fodlers and subfolders, the user can manipulate the data he or she wishes to display and evaluate.

Placemarks can be further enhanced by incorporating images. In this case, an image is added by incorporating a web or network link to the relevant image. This feature can be used to provide images of activity, evidence, or other information of relevance. Images can be added to any placemark using the following HTML text: img src="XXX" /img The XXX inside of the quote marks is replaced with the network or web link to the image. Both img src="XXX" and /img are contained within the < and > brackets, which again cannot be fully shown here. In the following image, the dialog box displayed has a picture added.
Images should be stored locally on a shared fileserver if possible. This allows users to use the same basic file path to locate images, removing some of the difficulty involved.

Paths and Polygons

Paths and polygons can also be effective tools. They are added using the path or polygon tools at the top of the screen. In a polygon, clicking on the screen will place a corner, and in a path, clicking on the screen will drop a point along the route. Polygons can be filled or outlined, and both features can have their colors, width, and other features edited. Also, both features have dialog boxes which can be edited using the same method as that found in the placemarks. Clicking on any point along the path or polygon will result in the dialog box being displayed.

The image below denotes a use for the path feature. In this example two paths are denoted. The green path denotes a patrol route for a patrol car, with the blue path denoting a patrol route for an officer on foot.
The image below denotes a use for the polygon feature. In this example different colored polygons are being used to denote different gang turfs.
A placemark database can be saved by selecting the most upper-level folder, which in this case would be Precinct 117, right clicking, and selecting Save As. This will save placemarks as well as any other features such as paths or polygons that are present. Alternatively, Google Earth saves the same files in the My Places directory upon exit. When exiting Google Earth, the Server Log Out option under the File menu in the menu bar should be selected first. This ensures that the placemark data is saved without loss of data. At times Google Earth can fail to save recently entered data if the program is simply exited.

Network Links

One way of effectively sharing placemark data, and ensuring that it is entered consistently using a prescribed format, is to manage the files on one computer. The placemark files would then be shared to other users using a network link. In this case, it is necessary to manage the placemark files as a separate dataset, loading the files into Google Earth when editing or data entry is required.

In this method, the user would load a placemark dataset into Google Earth by clicking Control-O and selecting the dataset from a shared network drive or internet source. Any editing is then done, before the dataset is re-saved to the previous location. To access the information, a network link is generated. This is done by selecting Add Network Link from the Add menu in the menu bar at the top of the screen. In the dialog box that appears, the pathway to the file is included in the Link box. This network link can then be saved independently and shared to various users via email or by posting it to an intranet or shared server. When the users open the network link, they will immediately have access to the dataset.

ANALYTICAL USES

While it can take a considerable amount of time to initially generate a dataset, once it has been generated and proper procedures have been developed for incorporating new data it can prove to be a very useful analytical tool.

Many of the previously mentioned law enforcement functions can be significantly enhanced by employing a robust dataset in Google Earth. For example, simply marking and tracking the locations of arrests or crimes can be used to adjust patrol routes to ensure that they pass through areas with a significant amount of activity. In this instance, proper use of Google Earth and a developed dataset can eventually serve as a deterrent to criminal activity.

Likewise, a developed dataset can allow a law enforcement organization to properly allocate resources in a region, ensuring that high-crime areas have the necessary resources to adequately serve the public. This is a prime example of the financial benefit of geospatial information technology.

Counterdrug Operations

One aspect of law enforcement where GIS technologies such as Google Earth can be effective is in counterdrug operations. Using the aforementioned techniques, locations of drug-related arrests or locations of drug-related points of entry or facilities can be tracked.

Consider the following image. Assuming that the marked locations are distribution points of drugs entering the United States from Mexico, a host of analytical options can be described.
Once locations are known and marked, various options are available for analysis. The most obvious involves discerning potential routes of travel for distribution. Simple analysis can be performed, asking questions such as "do they travel at night" or "are they using heavy or light vehicles". Knowing when and how drugs are being transported can serve to more accurately identify potential routes of travel. Light vehicles may be more likely to make use of minor or even unpaved roadways in a given region, which are often patrolled far less frequently. Being able to exploit a gods-eye view of the area can often help to make such analytical decisions easier to understand.

Furthermore, being able to visually observe drug-related activity in a program such as Google Earth can aid in the identification of distribution facilities or production centers. When a number of drug-related arrests, particularly those involving the sale of controlled substances, are marked in a given area, analysis can be performed on the dataset to identify likely distribution centers. One such method can be to determine the facilities relatively equidistant from each arrest, and marking them for further investigation. Other intelligence sources can also be used in combination with the available data to effectively analyze the overall picture in a given area or region.

Gang Activity

Gang activity can also be evaluated using Google Earth. A previous image depicted two notional gang territories in Phoenix. Simply marking such regions can be a useful endeavor. Areas where two or more territories abut against one another can be potentially volatile regions. A logical use for this data would be to manage patrols in the area to forestall any violent action to a degree.

Territories themselves can be evaluated and marked using analysis of gang symbology in a region. A previous example depicted an image of gang symbology inserted into the dialog box associated with a placemark. Marking these occurrences in Google Earth can serve as a way of identifying the breadth of a particular gang's territory. Furthermore, an officer or agent assigned to a particular area can exploit such a placemark as a reference source on the potential symbology associated with a region. Then, if a different set of symbology is discovered, gang territories can be updated accordingly. This can aid in the understanding of the fluidity of territories in some areas.

Border Security

One of the most critical problems facing law enforcement agencies in some areas is border security. A three dimensional viewer such as Google Earth can be an effective tool in evaluating and combating border incursions.

Having three dimensional terrain to evlauate can often provide insight into potential routes of ingress by illegal aliens. Being able to visualize the terrain in a region can aid law enforcement agencies in discerning how illegals manage to cross the border unobserved. Often, terrain can be exploited by these criminal groups to mask their presence from population centers in a given region. The analyst need simply ask the question "where can they be hidden from view" to discover potential ingress routes which may not have been apparent simply by examining a two dimensional map of the area.

Such analysis can also aid in other areas, such as discovering border crossing zones where illegal substances are brought into the nation. While these techniques alone will not necessarily identify these areas conclusively, they can certainly aid in developing a starting point for any investigation.

CONCLUSION

Google Earth by itself is not going to put an end to crime in America. Nor should it be used as the sole source or method for performing analysis and evaluating potential courses of action by any law enforcement agency. However, it can clearly be seen that effective analysis coupled with a robust set of data to evaluate can most definitely have benefits to any law enforcement agency. Law enforcement agencies would certainly benefit from proper exploitation of this freely available resource.

SOURCES

-Satellite imagery provided courtesy of Google Earth

Tuesday, August 17, 2010

Schedule Changes

A few minor scheduling details. First off, the Image of the Week will now be posted on Wednesdays. This will work better with my upcoming fall schedule. Also, this week's feature has been changed. Instead of doing a comparison of FalconView with Google Earth, something that is going to take a lot more time and is probably better suited as an uploaded PDF document, I'll be posting a feature about using Google Earth as a law enforcement tool. This is something I've been asked to produce and assist with, and is turning out to be an interesting exercise.

Sunday, August 15, 2010

The Japanese SAM Network

INTRODUCTION

Japan is a heavily populated nation spread out over a series of islands in the Western Pacific. American and Japanese SAM systems have protected Japanese airspace since the early days of the Cold War. Aging systems and recent developments in the region have led Japan to begin fielding a modern air defense and anti-missile network.

OVERVIEW

Japanese SAM systems are subordinate to both the JGSDF and the JASDF. The JGSDF operates the HAWK and Chu-SAM systems, with Japanese Patriot batteries being operated by the JASDF. However, JASDF control networks provide targeting and EW support for all SAM systems in Japan, as the JASDF operates the Aircraft Control and Warning Wings manning Japan's EW sites. 5 JGSDF units and six JASDF units are equipped with HAWK or Patriot SAMs.

EW

24 active and one inactive EW site form the basis of Japan's early warning network. These sites are located around the periphery of Japan and provide support for both JASDF and JGSDF SAM units. The bulk of these locations operate the indigenous FPS-3 EW radar.

The locations of Japan's EW sites can be seen in the image below:
PATRIOT

In 1984 Japan chose the Patriot missile system to replace its aging Nike-Hercules batteries. The initial PAC-1 batteries were upgraded to PAC-2 standard. Six missile groups operate the Patriot in the JASDF, oriented throughout the nation. These batteries are primarily located on the grounds of former Nike-Hercules units, taking advantage of the hardened revetments already present to protect the TELs.

A representative Patriot battery can be seen in the image below. This site is located near Tokyo, and is a former Nike missile position. The main upgrade performed to Nike sites allowing Patriot operation is the inclusion of a raised berm for the AN/MPQ-53 engagement radar, which can clearly be seen. Amusingly, two of the site's former occupants remain as gate guards.
The locations and coverage zones of Japan's Patriot batteries can be seen in the image below. A portion of the Patriot batteries located on Okinawa are in fact operated by the US Army, but cannot sufficiently be differentiated based on the imagery available. As such, they are all included here.
HAWK AND CHU-SAM

The JGSDF has operated the HAWK missile system since 1965. Eleven batteries appear to remain active in available imagery, with other batteries held in-garrison at various locations.

The locations and coverage zones of Japan's active HAWK batteries can be seen in the image below:
Chu-SAM, the Mitsubishi Type 03, is Japan's indigenous replacement for the HAWK in JSGDF service. Chu-SAM was inducted in 2005, with the first training firings taking place at Fort Bliss, Texas in late 2006. The extent of Chu-SAM deployment is not currently known. Chu-SAM will offer a significant capability increase in terms of performance and mobility when compared to the HAWK.

Chu-SAM components can be seen in-garrison near Tokyo in the image below:
MISSILE DEFENSE

The increasing threat of DPRK ballistic missiles has led Japan to pursue a relatively robust BMD network. There are three primary components to the system: sensors, land-based PAC-3 missiles, and sea-based SM-3 missiles. The system began to be studied in 1995, with the first component, the PAC-3, becoming operational in 2007. PAC-3 systems were deployed to northern Japan in 2009 in anticipation of DPRK missile tests.

The BMD sensor network will consist of three radar types. Seven FPS-3 radars in the existing EW network have been modified to improve missile detection capabilities. In addition, four new FPS-5 phased-array radars (previously developed as the FPS-XX) will be built by 2012. In the interim, a US FBX-T radar system deployed to Japan in June of 2006 to provide BMEW capability. This system was deployed at Shariki in northern Japan. The US also began operating PAC-3 missiles at Kadena in late 2006.

Japan's projected land-based BMEW network can be seen in the image below. Modified FPS-3 sites are marked with light blue circles, FPS-5 radar site locations are marked with dark blue circles, and the FBX-T radar location is marked as a yellow circle.
The FBX-T radar system can be seen in the image below. This radar has been used to monitor DPRK missile tests. This is a temporary location, with a more permanent site being constructed approximately 1 kilometer to the south.
For the sea-based portion of the network, four Kongo-class AEGIS destroyers will be upgraded and equipped to fire the SM-3. Work on these four vessels, the Kongo, Chokai, Myoko, and Kirishima, will be complete by the end of 2010. Kongo completed modifications in 2007 and conducted Japan's first AEGIS missile intercept in December of that year.

Modification of Japan's command and control networks to incorporate the new BMD capabilities and mission will be completed by 2012

CONCLUSION

The changing threat environment, coupled with the age of legacy systems such as the HAWK, have led Japan to develop one of the most modern air defense networks found in the world. When the BMD network is fully operational after 2012, Japan will have provided its citizens with a robust defensive capability to repel both air and missile attacks on its soil.

SOURCES

-Satellite imagery provided courtesy of Google Earth

PAC-3 deployed
PAC-3 flight test
Chu-SAM
Chu-SAM testing

Japan's Missile Defense, March 2007
Overview of Japan's Defense Policy, Japanese MoD
Defense White Paper, Japanese MoD, 2009

Monday, August 2, 2010

SAM Site Overview info

I'll get around to uploading all of the new files a bit later, but here are some changes to the SAM Site Overview that you might notice:

-S-200 (SA-5 GAMMON) ranges: ranges for non-FSU users have been reduced to 250 km to correspond with the S-200VE export variant. FSU users remain at 300 km, as they could in theory have the S-200D lying around.

-55Zh6 (TALL RACK) EW radars: these now have light blue range rings. Also, site icons are also light blue. The actual icons are the same as before, either diamonds (EW sites) or circles (36D6 EW sites). Now if you see one that's light blue instead of "normal" blue, you know a 55Zh6 radar is present.

-Bunch of new historical BOMARC, Nike and HAWK sites have been added to the USA. I was working out of a book titled Rings of Supersonic Steel (really great read if you can find it), and only marked the launch positions.

Other than that, the rest of the updates are normal stuff and will be listed in the corresponding post when I've uploaded the new files.

Now, since I know you all followed instructions and went to see Predators, you may henceforth commence waiting for the return of the Vault Dweller in October. Preferably while listening to City of Fire.