INTRODUCTION
One of the most populous nations in the world, India has engaged in numerous regional conflicts in the past. The threat environment led to the creation of a point-defense oriented EW and SAM network designed not to protect the skies over India, but to protect the military units tasked with such a role. This ultimately led to the creation of a number of EW and SAM units within the Indian Air Force.
OVERVIEW
Indian air defense elements, to include EW assets, SAM systems, and interceptors, are subordinate to the Indian Air Force (IAF). This allows the IAF to coordinate both sensors and weapons, allowing for a maximum degree of target deconfliction. SAM units are organized as squadrons, with radar units being organized as either signal units or transportable radar units, depending on the assigned types. These units are in turn subordinate to the five operational commands in the IAF.
The Indian SAM network follows a point defense layout. The primary SAM system employed by the IAF is the S-125M (SA-3B GOA). These systems are deployed at various airbases in the northern and western portions of India. EW assets are deployed primarily along border regions, with the highest concentration being present along the northern and western borders with Pakistan.
EW ASSETS
Fifty four EW sites have been identified in India. The primary assets are THD-1955, P-12/18 (SPOON REST), and 36D6 (TIN SHIELD) radars. Thirteen THD-1955 radars arrayed primarily along the border region from Pakistan to Myanmar provide a significant amount of EW coverage. EW coverage is enhanced by fourteen 36D6 radar sites, arrayed primarily along the border with Pakistan. The 36D6 is significant as it can provide both target track data to SAM batteries as well as GCI support for Russian-origin fighter aircraft such as the MiG-29 (FULCRUM) or Su-30MKI (FLANKER-H). P-12/18 radar sites are scattered throughout the region, as are indigenous Indra-II radar units. The net result is an EW network that is heavily oriented towards potential threats.
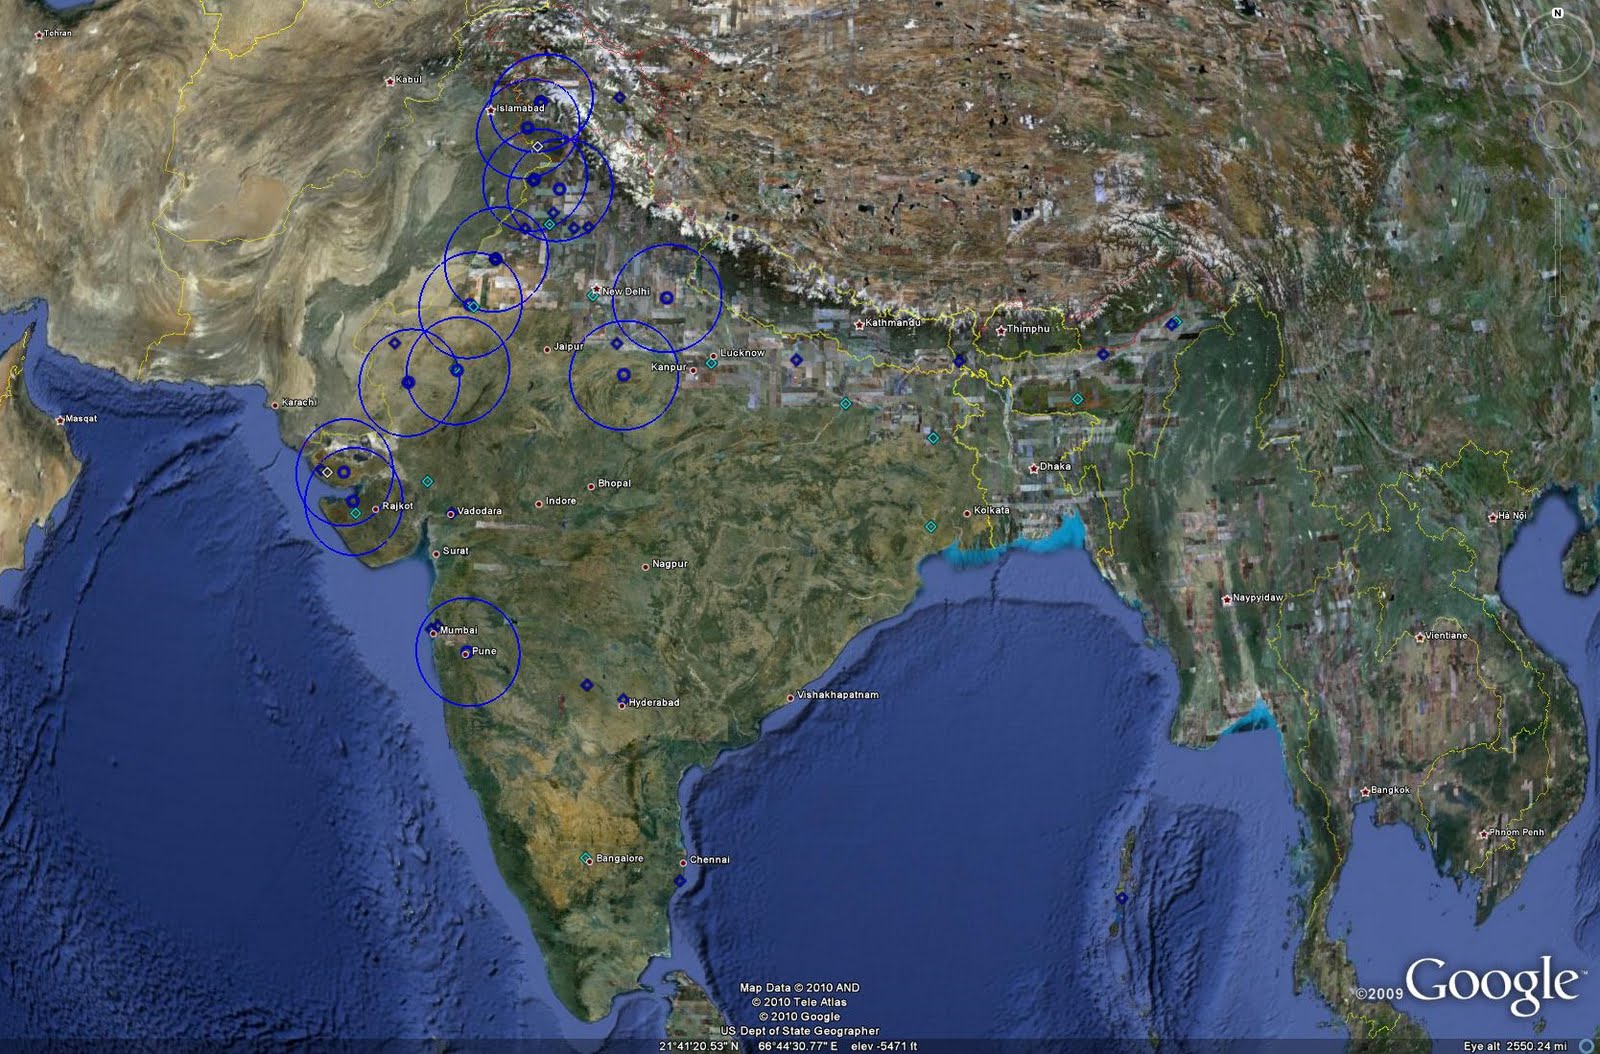
The following image depicts the locations of identified Indian EW facilities. Dark blue diamonds represent basic EW sites, typically manned by P-12/18 or Indra-II radar systems, while light blue diamonds represent THD-1955 radar facilities. Blue circles represent 36D6 radar facilities. The range rings given for the 36D6 sites represent the 165 km acquisition range against a typical fighter-size target. Each radar system is capable of target detection at greater ranges depending on the target RCS and altitude, with the THD-1955 typically employing a range of 400 km.
 The following image depicts a typical THD-1955 site. These large radars are sited atop dedicated structures. This site is located south of Shillong in eastern India.
 The following image depicts a deployed 36D6 radar at Pune AB in western India. This radar likely serves as both an EW and GCI asset, given its co-location with Su-30MKI fighters.
 India does possess the 40V6 series of masts for mounting the 36D6, although their use appears to be relatively infrequent. The following image from February 2008 depicts a 36D6 mounted atop a 40V6 mast assembly at Nal AB. Imagery captured four months later indicates that the 36D6 is still deployed but has been removed from the 40V6. Only thee 36D6 locations have an identifiable 40V6 series mast available for use.
 Other EW assets include the A-50I AWACS based at Agra AB, and potentially an aerostat system found near the border with Pakistan. The aerostat system's purpose is unknown at this time, but could potentially be used to mount an air surveillance system. The facility can be seen in the image below.
 THE S-125
India's primary strategic SAM system is the S-125M. These systems were delivered between 1973 and 1989 from the USSR, and thirty four batteries are currently active. These batteries provide point defense for key military installations, typically airbases, in the northern and western portions of India.
The locations of India's active S-125M batteries and their engagement zones can be seen in the image below:
 The S-125M has two specific drawbacks: range and single-target engagement capability. The ability of the system to engage one target per battery is partially mitigated by placing multiple batteries at many locations, but the 25 km maximum range of the system effectively reduces its role to one of point defense only, lacking the range to provide long-range overlapping fields of fire necessary for a more robust air defense network.
IAF S-125M batteries are frequently relocated in their operating areas. This can be done to complicate targeting by enemy assets and to allow systems to be cycled through maintenance periods. The following image depicts the S-125M deployment area at Vadodara AB in western India. While only one location currently has an active battery, there are four other locations which have been active at some point in the past.
 Numbering the S-125M locations 1 through 5 from west to east, the following information can be derived from available imagery:
Site 1
-Active from December 2005 to March 2010
Site 2
-Active from October 2000 to October 2002
-Active from June 2003 to November 2003
-Active from December 2003 to March 2010
Site 3
-Active from October 2000 to October 2002
Site 4
-Active from November 2003 to December 2005
-Currently active as of March 2010
Site 5
-Active from June 2003 to March 2010
All told, there are twenty one inactive or former S-125M positions identified throughout India that can be used as relocation sites should the need arise.
TACTICAL SYSTEMS
Tactical SAM systems are also operated as point defense assets in the IAF. The primary system is the Osa-AKM (SA-8 GECKO), a mobile system mounted on a wheeled TELAR. The 10 km range of the system allows it to serve as a layered short-range counterpart to co-located S-125M batteries.
An IAF Osa-AKM TELAR can be seen in-garrison near Ambala AB in the image below.
 The Indian Army operates the 2K12 Kvadrat (SA-6 GAINFUL), which could be employed in a similar capacity to IAF Osa-AKM units if required. The Army also operates additional Osa-AKM units.
LIMITATIONS
Given that India has chosen to rely on a point-defense oriented air defense network, the lack of long-range SAM coverage is not a true limitation. Furthermore, the presence of significant numbers of fighter aircraft such as the Su-30MKI cpaable of acting in concert with the EW network to perform interception tasks can alleviate the lack of long-range SAM coverage. However, there are still some limitations to be addressed within the network as it is currently organized.
The primary limitation is one of terrain. Northern and eastern India contains very varied terrain, which can introduce significant blind spots in radar or SAM coverage, reducing the network's effectiveness. The issue of EW coverage has been addressed to a degree by the procurement of the A-50I AWACS platform.
The other significant limitation faced by the strategic SAM network is one of age. While many of the systems have been refurbished or modified to retain their effectiveness, the age of the systems is such that a potential aggressor has enjoyed a significant amount of time to discern weaknesses and develop ECM systems and countertactics to defeat the deployed systems. In truth, it is the age of many of these systems that has pushed India towards developing and procuring new SAM systems to replace the elderly systems currently in widespread use.
ABM DEVELOPMENTS
One significant aspect of Indian air defense that will become operational in the near future is an ABM capability. India began researching an ABM system in 1999, with the goal of fielding a two-tier system. The two-tier system would consist of the exoatmospheric PAD, a Prithvi SRBM derivative, and the endoatmospheric AAD. Where PAD employs a directional warhead, AAD employs a hit-to-kill kinetic warhead. It is now believed that a new weapon referred to as PDV will replace the PAD in the two-tier structure. This system is capable of engaging 1500 km range ballistic missiles, making it an ATBM rather than a true ABM system, but a separate system with a design goal of engaging 5000 km range weapons is underway to field a true ABM.
The radar syste employed by the PAD/AAD weapons is referred to as Swordfish and is in actuality a modified Israeli EL/M-2080 Green Pine radar system. Two of these radars were delivered to India in 2002. One is currently sited northeast of Bangalore, with the second being located near Konark on India's northeast coast. The radars are sited in protective domes. The inland facility can be seen in the image below:
 FUTURE PROSPECTS
India is actively developing and acquiring new SAM systems to revitalize its air defense force for the 21st Century. There are three significant programs which should begin to bear fruit in the near term. The first is the Akash, being procured by the IAF to potentially replace S-125M systems. This is an indigenous mobile SAM system derived in part from the 2K12. Maitri is a short-range SAM being co-developed with France, employing technology used in the French Mica BVR AAM. The third program is a long-range SAM system. This system may build upon the aforementioned AAD weapon under the codename of Ashvin. Deployment of these weapon systems will eventually allow the IAF to retire the S-125M and Osa-AKM, replacing them with weapons more capable of performing effectively in the current environment.
CONCLUSION
While India's SAM network does not appear to be particularly robust or capable on paper, it is not intended to serve as the primary protector of the nation's airspace. However, even with its more limited role, modernization programs must continue if the network is to remain viable in the forseeable future.
SOURCES
-Satellite imagery provided courtesy of Google Earth
IAF Orbat
SIPRI
PAD Test
One of the most populous nations in the world, India has engaged in numerous regional conflicts in the past. The threat environment led to the creation of a point-defense oriented EW and SAM network designed not to protect the skies over India, but to protect the military units tasked with such a role. This ultimately led to the creation of a number of EW and SAM units within the Indian Air Force.
OVERVIEW
Indian air defense elements, to include EW assets, SAM systems, and interceptors, are subordinate to the Indian Air Force (IAF). This allows the IAF to coordinate both sensors and weapons, allowing for a maximum degree of target deconfliction. SAM units are organized as squadrons, with radar units being organized as either signal units or transportable radar units, depending on the assigned types. These units are in turn subordinate to the five operational commands in the IAF.
The Indian SAM network follows a point defense layout. The primary SAM system employed by the IAF is the S-125M (SA-3B GOA). These systems are deployed at various airbases in the northern and western portions of India. EW assets are deployed primarily along border regions, with the highest concentration being present along the northern and western borders with Pakistan.
EW ASSETS
Fifty four EW sites have been identified in India. The primary assets are THD-1955, P-12/18 (SPOON REST), and 36D6 (TIN SHIELD) radars. Thirteen THD-1955 radars arrayed primarily along the border region from Pakistan to Myanmar provide a significant amount of EW coverage. EW coverage is enhanced by fourteen 36D6 radar sites, arrayed primarily along the border with Pakistan. The 36D6 is significant as it can provide both target track data to SAM batteries as well as GCI support for Russian-origin fighter aircraft such as the MiG-29 (FULCRUM) or Su-30MKI (FLANKER-H). P-12/18 radar sites are scattered throughout the region, as are indigenous Indra-II radar units. The net result is an EW network that is heavily oriented towards potential threats.
The following image depicts the locations of identified Indian EW facilities. Dark blue diamonds represent basic EW sites, typically manned by P-12/18 or Indra-II radar systems, while light blue diamonds represent THD-1955 radar facilities. Blue circles represent 36D6 radar facilities. The range rings given for the 36D6 sites represent the 165 km acquisition range against a typical fighter-size target. Each radar system is capable of target detection at greater ranges depending on the target RCS and altitude, with the THD-1955 typically employing a range of 400 km.
 The following image depicts a typical THD-1955 site. These large radars are sited atop dedicated structures. This site is located south of Shillong in eastern India.
 The following image depicts a deployed 36D6 radar at Pune AB in western India. This radar likely serves as both an EW and GCI asset, given its co-location with Su-30MKI fighters.
 India does possess the 40V6 series of masts for mounting the 36D6, although their use appears to be relatively infrequent. The following image from February 2008 depicts a 36D6 mounted atop a 40V6 mast assembly at Nal AB. Imagery captured four months later indicates that the 36D6 is still deployed but has been removed from the 40V6. Only thee 36D6 locations have an identifiable 40V6 series mast available for use.
 Other EW assets include the A-50I AWACS based at Agra AB, and potentially an aerostat system found near the border with Pakistan. The aerostat system's purpose is unknown at this time, but could potentially be used to mount an air surveillance system. The facility can be seen in the image below.
 THE S-125
India's primary strategic SAM system is the S-125M. These systems were delivered between 1973 and 1989 from the USSR, and thirty four batteries are currently active. These batteries provide point defense for key military installations, typically airbases, in the northern and western portions of India.
The locations of India's active S-125M batteries and their engagement zones can be seen in the image below:
 The S-125M has two specific drawbacks: range and single-target engagement capability. The ability of the system to engage one target per battery is partially mitigated by placing multiple batteries at many locations, but the 25 km maximum range of the system effectively reduces its role to one of point defense only, lacking the range to provide long-range overlapping fields of fire necessary for a more robust air defense network.
IAF S-125M batteries are frequently relocated in their operating areas. This can be done to complicate targeting by enemy assets and to allow systems to be cycled through maintenance periods. The following image depicts the S-125M deployment area at Vadodara AB in western India. While only one location currently has an active battery, there are four other locations which have been active at some point in the past.
 Numbering the S-125M locations 1 through 5 from west to east, the following information can be derived from available imagery:
Site 1
-Active from December 2005 to March 2010
Site 2
-Active from October 2000 to October 2002
-Active from June 2003 to November 2003
-Active from December 2003 to March 2010
Site 3
-Active from October 2000 to October 2002
Site 4
-Active from November 2003 to December 2005
-Currently active as of March 2010
Site 5
-Active from June 2003 to March 2010
All told, there are twenty one inactive or former S-125M positions identified throughout India that can be used as relocation sites should the need arise.
TACTICAL SYSTEMS
Tactical SAM systems are also operated as point defense assets in the IAF. The primary system is the Osa-AKM (SA-8 GECKO), a mobile system mounted on a wheeled TELAR. The 10 km range of the system allows it to serve as a layered short-range counterpart to co-located S-125M batteries.
An IAF Osa-AKM TELAR can be seen in-garrison near Ambala AB in the image below.
 The Indian Army operates the 2K12 Kvadrat (SA-6 GAINFUL), which could be employed in a similar capacity to IAF Osa-AKM units if required. The Army also operates additional Osa-AKM units.
LIMITATIONS
Given that India has chosen to rely on a point-defense oriented air defense network, the lack of long-range SAM coverage is not a true limitation. Furthermore, the presence of significant numbers of fighter aircraft such as the Su-30MKI cpaable of acting in concert with the EW network to perform interception tasks can alleviate the lack of long-range SAM coverage. However, there are still some limitations to be addressed within the network as it is currently organized.
The primary limitation is one of terrain. Northern and eastern India contains very varied terrain, which can introduce significant blind spots in radar or SAM coverage, reducing the network's effectiveness. The issue of EW coverage has been addressed to a degree by the procurement of the A-50I AWACS platform.
The other significant limitation faced by the strategic SAM network is one of age. While many of the systems have been refurbished or modified to retain their effectiveness, the age of the systems is such that a potential aggressor has enjoyed a significant amount of time to discern weaknesses and develop ECM systems and countertactics to defeat the deployed systems. In truth, it is the age of many of these systems that has pushed India towards developing and procuring new SAM systems to replace the elderly systems currently in widespread use.
ABM DEVELOPMENTS
One significant aspect of Indian air defense that will become operational in the near future is an ABM capability. India began researching an ABM system in 1999, with the goal of fielding a two-tier system. The two-tier system would consist of the exoatmospheric PAD, a Prithvi SRBM derivative, and the endoatmospheric AAD. Where PAD employs a directional warhead, AAD employs a hit-to-kill kinetic warhead. It is now believed that a new weapon referred to as PDV will replace the PAD in the two-tier structure. This system is capable of engaging 1500 km range ballistic missiles, making it an ATBM rather than a true ABM system, but a separate system with a design goal of engaging 5000 km range weapons is underway to field a true ABM.
The radar syste employed by the PAD/AAD weapons is referred to as Swordfish and is in actuality a modified Israeli EL/M-2080 Green Pine radar system. Two of these radars were delivered to India in 2002. One is currently sited northeast of Bangalore, with the second being located near Konark on India's northeast coast. The radars are sited in protective domes. The inland facility can be seen in the image below:
 FUTURE PROSPECTS
India is actively developing and acquiring new SAM systems to revitalize its air defense force for the 21st Century. There are three significant programs which should begin to bear fruit in the near term. The first is the Akash, being procured by the IAF to potentially replace S-125M systems. This is an indigenous mobile SAM system derived in part from the 2K12. Maitri is a short-range SAM being co-developed with France, employing technology used in the French Mica BVR AAM. The third program is a long-range SAM system. This system may build upon the aforementioned AAD weapon under the codename of Ashvin. Deployment of these weapon systems will eventually allow the IAF to retire the S-125M and Osa-AKM, replacing them with weapons more capable of performing effectively in the current environment.
CONCLUSION
While India's SAM network does not appear to be particularly robust or capable on paper, it is not intended to serve as the primary protector of the nation's airspace. However, even with its more limited role, modernization programs must continue if the network is to remain viable in the forseeable future.
SOURCES
-Satellite imagery provided courtesy of Google Earth
IAF Orbat
SIPRI
PAD Test


