Showing posts with label National Security. Show all posts

Thursday, May 17, 2012

Google Boats?

According to a news piece posted by AOL, Google is developing the ability to track and display the locations of ships at sea.

All of them.

Well, at least those actively using AIS transponders, but still.

This is a pretty interesting development, if you ask me.  Some of the benefits are obvious, and are mentioned in the article.

Then there's the fact that you could theoretically track the movement of military forces worldwide.  Provided they operate with AIS transponders active, that is.

I'd think that this represents a great tool to exploit off of the Horn of Africa.  Military vessels in the area with transponders active could act like homing beacons for shipping in the area, guiding them through protected waters and serving as a pirate deterrent.  The authors naturally assume that such new technology would obviously represent some sort of terrorist tool for attacking targets (because what else is Google Earth but a mapping program of terrorist targets, right?), but if American, Chinese, or whoever's naval units are operating in the clear, hey, go ahead and try it.  I'm willing to bet that in the battle of terrorist vs. 5 inch round or terrorist vs. CIWS, the winner will not be the guy with nefarious intentions.  Plus, in case they haven't noticed, terrorists and pirates are already attacking boats.

The really interesting bit of the article is Google's plan to map the entire seafloor in high resolution over five years.  Again, the assumption is that this will lead to all sorts of security problems when crashed spy satellites are located and the Chinese or Russians go out to lift them off the bottom.  Always with the negative waves, Moriarity.  Always with the negative waves.  Me, I'd like to see them locate Jack Weeks' A-12, to finally put an end to one of the unsolved tragedies of the CIA's OXCART program.

Of course, locating K-129 would be amusing too...we'd then know just how much of the sub was lifted off of the bottom by the CIA.  I'm not sure which would be more amusing, finding only a few pieces of the sub on the bottom, or the entire thing.

The article closes with the following line from an unnamed intelligence community source, after a brief bit about how Google services have little intelligence utility whatsoever in their minds:  "Just because you have the data, doesn't mean you can analyze the data or know how to use it."

Sure, I'll take that as a challenge.  Or maybe a mission statement...

And see?  I told you I'd be posting here again.

Monday, September 6, 2010

Does All of Our Intelligence Data Pass The "So What" Test?

Data relevance is critical to achieving success in the Intelligence Community (IC). Simply put, everything that we do must pass the “so what?” test, and we need to move away from creating intelligence data for intelligence’ sake. This means that every intelligence product and briefing should have a clear goal and tangible outcomes.

The unfortunate reality is that many of the IC’s efforts do not come close to passing this test. All too often, our intelligence lacks relevance or does not tangibly support a mission. The main issue is a lack of insight into goals based on achieving measurable outcomes.

The following is an example of viable intelligence that would clearly pass the “so what?” test based on tangible outcomes. Imagine that we have identified and then targeted a Taliban kidnapping ringleader, and our intel products/briefings make the argument that we have this terrorist's pattern of life and furthermore, by removing him, we will halt kidnappings in this region for a three-month period. This provides our Commander with a clear “so what?” This intelligence matters. Our Commander and staff, primarily his Operations Officer, are able to analyze the means available to them and formulate an appropriate plan to intervene. By collecting and providing the data needed to remove this leader, the key outcome is the fact that kidnappings decrease in this region. The goal of this mission was to decrease kidnappings and make this region safer, so the outcome was achieved.

From a terrain perspective, many analysts provide data about the slope, vegetation, hydrography, cover and concealment, and location of roads that could play a major role in determining the ideal location of the enemy’s SCUD launchers and associated support vehicles. The “so what?” factor is that by correctly analyzing, interpreting, combining with other intelligence disciplines, and then disseminating this data, we can predict likely SCUD locations. Similar analysis can offer Primary, Alternate, and Supplementary positions for our own Field Artillery units or ideal Drop Zones and Helicopter Landing Zones.

These examples of providing actionable intelligence seem very intuitive, and one would expect these types of efforts to be commonplace. Unfortunately, they are not all that common. One of the driving issues behind this challenge is the myriad of available data.

In 2009, unmanned aerial vehicles (UAVs) alone generated 24 years worth of video if watched continuously. In 2010, UAVs are expected to generate 30 times that amount of data—and military commanders are acknowledging the issue. According to Lt. Gen. David A. Deptula, U.S. Air Force Deputy Chief of Staff for Intelligence, Surveillance, and Reconnaissance, “We are going to find ourselves in the not-too-distant future swimming in sensors and drowning in data.” (1)

The other challenge is focusing only on relevant data. For example, many believe that the IC is only marginally relevant to the overall strategy in Afghanistan because the majority of our collection efforts and analytical prowess are focused on insurgent groups. As such, our vast intelligence apparatus still finds itself unable to answer fundamental questions about the environment in which we operate and the people we are trying to persuade. (2)

The “so what?” factor in Afghanistan is determining who the local powerbrokers are that need to be influenced, as well as how we can best engage with locals—whether they are villagers, aid workers, or Afghan soldiers—to gain the credible insights we need to help advance the mission. (2)

Now that he has been appointed the new Director of National Intelligence, one of the key challenges that retired Lt. Gen. James R. Clapper Jr. hopes to tackle is to unite the traditionally separate missions of intelligence collection and analysis and to shrink and flatten the intelligence bureaucracy. (3) Clapper has also created the position of Deputy Director for Intelligence Integration to unify the collection and analysis tasks, which is a significant step toward addressing this issue. (4)

It certainly seems that IC leaders are taking this issue very seriously, and a top-down effort could bring about true change. However, all levels of the IC must continually ask themselves “so what?” If they are unable to answer this question, their efforts may be wasting the time and resources of our troops and policymakers—and these are resources that we cannot afford to waste.

-Lt. Col. (Ret.) Marv Gordner, 2010

REFERENCES

(1) “Too Much Information: Taming the UAV Data Explosion,” Defense Industry Daily, May 16, 2010
(2) Greg Dunlap, “Fixing Intel: A Blueprint for Making Intelligence Relevant in Afghanistan,” Marine Corps Gazette, December 9, 2009
(3) Ellen Nakashima, “New Intelligence Chief Clapper Brings Sense of Humor to Serious Job,” The Washington Post, August 21, 2010
(4) Pam Benson, “Director of National Intelligence Names Deputy to Boost Collaboration,” CNN, August 20, 2010

ABOUT THE AUTHOR

The preceeding article was written for this site by Lt. Col. (Ret.) Marv Gordner, a former intelligence officer in the US Army. Mr. Gordner has twenty-one years of extensive leadership and management experience in the Department of Defense and intelligence collection field. His assignments included the 101st Airborne Division and Special Operations Forces including, 5th Special Forces, 3d Special Forces, and the Joint Special Operations Command (JSOC). He now serves as the Program Manager, Intelligence Solutions Division, for MorganFranklin.

Friday, August 20, 2010

Google Earth & Law Enforcement

INTRODUCTION

GIS programs like Google Earth offer a lot of capabilities that can be exploited by various professional agencies. Access to overhead imagery, three dimensional environments, and the ability to edit and distribute information through the program make Google Earth in particular a useful analytical tool. One potential use for the program which seems to be underutilized is in the realm of law enforcement. While Google Earth is not a real-time imagery browser, a number of the capabilities it offers can enhance the performance of law enforcement functions.

This article represents a sanitized and reduced-scope version of a professional training tool developed by the author for a client in the Southwestern United States. It is intended to provide a basic overview of some of the capabilities of Google Earth valuable to law enforcement agencies and brief descriptions of how they can be effectively exploited.

AREA EXPLOITATION

One of the most obvious aspects of Google Earth that can be exploited is the ability to analyze the local environment. This can be of critical importance to any law enforcement agency planning surveillance or an offensive operation in a potentially unfamiliar area. While traditional maps and charts can offer a degree of understanding, Google Earth offers a far more robust set of features for extracting data.

Layout

The overhead nature of Google Earth provides an excellent medium for analyzing the layout of a given area, be it an urban, rural, or uninhabited location. Simply navigating to a point of interest provides the user with a significant amount of information. The status bar along the botom of the screen provides, from left to right, the date the imagery was acquired, the coordinates, the elevation, and the eye altitude.

The imagery capture date is significant as it allows the user to put the image in context. An older image may not show current features such as roads or buildings. Alternatively historical imagery can be browsed to view changes to the area that have been made over time.

The coordinates and elevation data are directly tied to the position of the on-screen cursor. As the cursor is moved around the screen, the coordinates and elevation data will change to account for the current position.

The eye altitude is the apparent position of the viewer above the image. For example, an eye altitude of 5,000 feet indicates that the image is what would be seen by an observer 5,000 feet above ground level.

Once an area of interest has been located, various features can be viewed by selecting different options in the Layers menu found at the bottom left of the screen. Some relevant features include roads, which will bring up the paths and names of various roads in an area, and other locations such as restaurants, bars, hospitals, water features, and terrain.

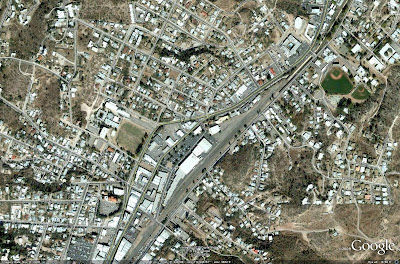
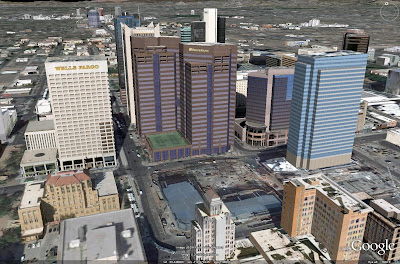
The following image depicts Nogales, Arizona, with the roads feature activated. Notice how both the pathways and names of the roads are overlaid on the overhead imagery.
Examining Terrain

Google Earth provides many ways to view the environment in three dimensions. The most common involves viewing the terrain in a given area. By selecting the terrain feature in the Layers menu, three dimensional terrain is loaded into the image.

Terrain data can also be manipulated to exaggerate features, making them more apparent to the observer. In the Options menu, accessed through the Tools section of the taskbar at the top of the screen, a number from 0.5 to 3 can be entered for Elevation Exaggeration. The default value is 1, which displays terrain at the natural scale.

Once terrain features are activated, pressing and holding the mouse wheel will bring up a special cursor on the screen. Pulling back on the mouse will tilt the image allowing terrain to be viewed in 3D. Pushing forward will then return the image to its traditional overhead state.

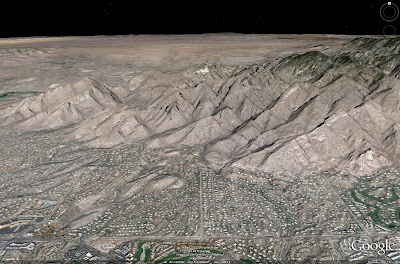
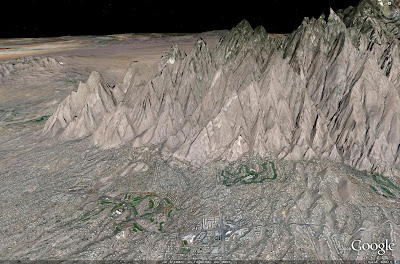
Consider the following two images, both depicting the terrain north of Tuscon, Arizona. Both images show the same approximate areas. The first image depicts the terrain with an elevation exaggeration value of 1, while the second image depicts the terrain with an elevation exaggeration value of 3. Notice how the features in the second image are greatly exaggerated to bring out their details.

Cities in 3D

3D buildings are available for many major metropolitan areas in Google Earth. These buildings are available in two formats, basic greyscale shapes and photorealistic structures. Greyscale shapes approximate the basic shapes of the buildings they represent, while the photorealistic versions have digital photographs applied to their surfaces to provide a more realsitic approximation of the structures.

3D buildings are accessed in the Layers menu, with the option for loading either grayscale, photorealistic, or both types of buildings available. These structures are created by Google and its user community using a program called Google Sketchup. Buildings are submitted to Google for inclusion into the database, which ensures that the most accurate structures are incorporated and are properly aligned with the imagery. Users can also create their own structures and access them locally.

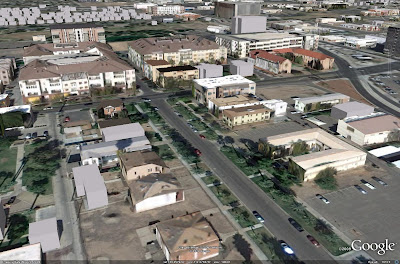
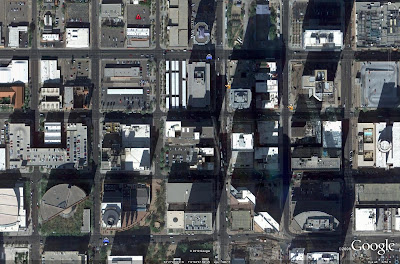
Phoenix, Arizona provides a suitable environment for examining both types of 3D structures available. In this case, as is the case with many locations, downtown Phoenix is primarily populated with photorealistic buildings, with the outlying areas relying primarily on greyscale structures.

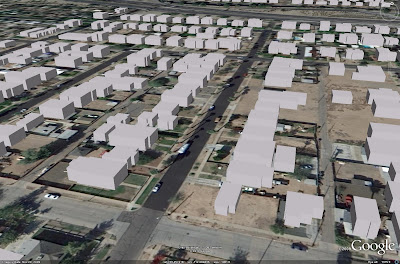
The image below illustrates a residential area northwest of downlown Phoenix. This area has been constructed using greyscale buildings.
The image below illustrates downtown Phoenix. The area has been rendered using photorealistic structures for added detail. Note how segments of the overhead imagery for Phoenix has been incorporated into the buildings for additional effect, including the imagery of a tennis court atop the lower level of the Ernst & Young complex.
The following image depicts a location in Phoenix where both types of building can be seen.
Uses

The various layout features of Google Earth lend themselves to a wide variety of law enforcemnt applications. Traditional activities such as foot or vehicle patrol routes can be planned to maximize the coverage available, ensuring that high interest areas are given the required amount of attention. Routes to and from locations of interest can be evaluated. By using the roads feature, any route can be properly planned, including those through areas or to locations which are not well known.

Apart from the basic features, having a three dimensional environment to exploit is a very useful tool. The most obvious advantage conferred by a three dimensional environment is the ability to evaluate fields of view from various positions. When planning an approach to a given location, for example, a three dimensional environment allows law enforcement officials to evaluate the most unobtrusive approach to a given location, taking the greatest advantage of surrounding structures or terrain. Likewise, in a situation where sniper support or some other form of overwatch is required, a three dimensional environment can be used to evaluate the most advantageous deployment locations for these assets, maximizing their fields of view of the area of interest with regard to other obstructions in the area.

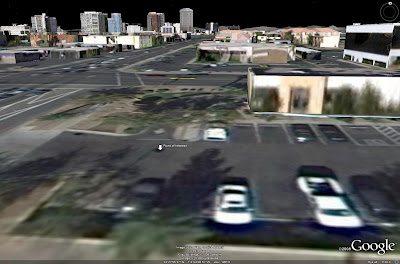
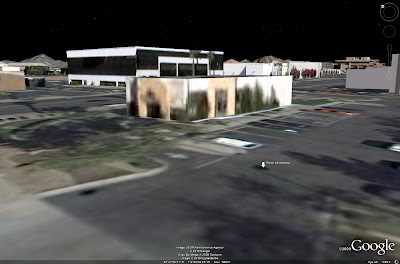
Consider the following example. In this instance, assume that the point of interest is a location to which police must be dispatched to deal with a developing situation. In an encounter such as this, success is often related to the ability to arrive with enough stealth to apprehend most or all of the individuals involved. Having a three dimensional view of the environment can be a significant asset in planning the proper route of approach.

In the first image, it can clearly be seen that a direct approach from the north is undesirable. The parking lot of the building across the street provides a clear field of view from the POI to identify any approaching units.
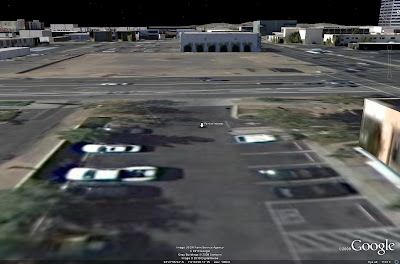
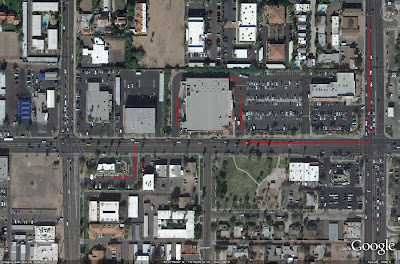
Likewise, an approach from the west may not be desirable. The following image illustrates that even with the building across the street to the west from the POI, the main street leading to the intersection can be monitored to a degree.
Approaching from the east and taking a less direct route can afford the greatest element of suprise. The building directly adjacent to the POI, combined with the large structures across the street to the northeast, can be used to mask the majority of any approach, as seen in the image below.
In this case, the route of approach can be seen in an overhead view in the image below.
Other routes can certainly prove as or more effective, particularly from the south, but this example illustrates how a three dimensional environment can be significantly useful in developing effective strategies.

The eye altitude information can be exploited to enhance helicopter support for organizations possessing these assets. Recall that the eye altitude represents the position of the observer above the image. This data can be used to set altitudes for helicopter assets to ensure that they are able to effectively monitor a given area. Attention should be given to the calibration of the altimeters in the helicopters. Most altimeters are calibrated to sea level. In this case, the correct altitude would be a combination of the eye altitude and the elevation. If the desired eye altitude is 5,000 feet and the local elevation is 1,000 feet, then the distance above sea level of the patrol should be reported as an altitude of 6,000 feet.

DATA INCORPORATION

Having a tool such as Google Earth to evaluate the layout of a given location can certainly enhance law enforcement activities, but where Google Earth becomes truly valuable is when user-generated data is incorporated into the program. This allows for a host of data analysis techniques to be applied. Data is entered into Google Earth using various annotations which can appear on-screen. These include placemarks, paths, polygon shapes, and external images.

Placemarks

The most effective way to incorporate data into Google Earth is by developing a set of placemarks. Placemarks appear on-screen and can be configured to display relevant details when clicked, providing a useful distribution medium for this information. It is important to develop an effective method of cataloging and detailing placemark files to ensure that they provide clear, concise information.

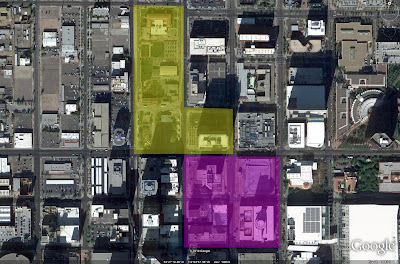
The following image depicts a portion of Phoenix displaying various placemarks denoting law enforcement activity. In this example, three different placemarks have been used. The blue vehicle denotes action by a patrol car, the orange silhouette denotes action by an office on foot, and the red triangle denotes hostile activity.
When clicked, each placemark will bring up a window such as the one seen in the image below.
In this case, the placemark has been filled with data according to the following template:

Activity
Arresting Officer (AO)
Date
Time
Location
Details
Report

This allows any user to access the relevant data about the incident in question noted by the palcemark. There is also a location to incorporate a weblink to any relevant paperwork or reporting on the incident, allowing it to be quickly accessed.

The formatting and content of the information on display can be managed locally but should always employ the same basic template for ease of use. In this example, clicking on any of the placemarks in the image above would result in the same window being displayed, the only difference being in the information contained therein.

To add information to a placemark, one simply edits the Edit Placemark box which is displayed when a placemark is first added to Google Earth. To edit the placemark after it is entered, simply right click on it and select Properties to bring up the same Edit Placemark box.

The previous examples were generated by simply copying and pasting the basic template into the dialog box and filling in the relevant details. To unclutter the screen, the placemark labels have their opacity set to zero in the Edit Placemark dialog box. This hides any text and only displays the icons. It does not affect the displaying of the relevant data when the placemarks are clicked in Google Earth. Leaving the label opacity set to the default of 100% will result in the placemark name being displayed adjacent to the placemark. When a large number of placemarks are displayed on-screen, this can make for a very cluttered environment.

It should be noted that the dialog box is HTML compatible, allowing the text to be highlighted or otherwise edited. However, due to this fact it is necessary to incorporate "br" following each line of text to denote a break or to simulate hitting the return key. The quotation marks should be replaced with < or > on either side of the "br", but this cannot be effectively shown here due to formatting restrictions.

If desired, there are resources available which can be used to develop a unique set of placemarks if those found in Google Earth do not represent the best method of display.

Placemarks can be organized using the My Places section of the Places menu at the left of the screen. By right clicking on My Places, Add Folder can be selected, allowing the user to add a named folder to store placemarks. Likewise, subfolders can be added for further organization. In this case, the placemarks have been stored in a folder titled Precinct 117, in a subfolder for Arrests. This subfolder is then divided into July and August 2010 subfolders. By selecting or deselecting various fodlers and subfolders, the user can manipulate the data he or she wishes to display and evaluate.

Placemarks can be further enhanced by incorporating images. In this case, an image is added by incorporating a web or network link to the relevant image. This feature can be used to provide images of activity, evidence, or other information of relevance. Images can be added to any placemark using the following HTML text: img src="XXX" /img The XXX inside of the quote marks is replaced with the network or web link to the image. Both img src="XXX" and /img are contained within the < and > brackets, which again cannot be fully shown here. In the following image, the dialog box displayed has a picture added.
Images should be stored locally on a shared fileserver if possible. This allows users to use the same basic file path to locate images, removing some of the difficulty involved.

Paths and Polygons

Paths and polygons can also be effective tools. They are added using the path or polygon tools at the top of the screen. In a polygon, clicking on the screen will place a corner, and in a path, clicking on the screen will drop a point along the route. Polygons can be filled or outlined, and both features can have their colors, width, and other features edited. Also, both features have dialog boxes which can be edited using the same method as that found in the placemarks. Clicking on any point along the path or polygon will result in the dialog box being displayed.

The image below denotes a use for the path feature. In this example two paths are denoted. The green path denotes a patrol route for a patrol car, with the blue path denoting a patrol route for an officer on foot.
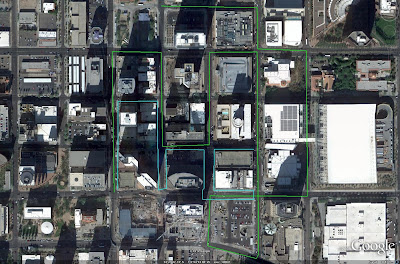
The image below denotes a use for the polygon feature. In this example different colored polygons are being used to denote different gang turfs.
A placemark database can be saved by selecting the most upper-level folder, which in this case would be Precinct 117, right clicking, and selecting Save As. This will save placemarks as well as any other features such as paths or polygons that are present. Alternatively, Google Earth saves the same files in the My Places directory upon exit. When exiting Google Earth, the Server Log Out option under the File menu in the menu bar should be selected first. This ensures that the placemark data is saved without loss of data. At times Google Earth can fail to save recently entered data if the program is simply exited.

Network Links

One way of effectively sharing placemark data, and ensuring that it is entered consistently using a prescribed format, is to manage the files on one computer. The placemark files would then be shared to other users using a network link. In this case, it is necessary to manage the placemark files as a separate dataset, loading the files into Google Earth when editing or data entry is required.

In this method, the user would load a placemark dataset into Google Earth by clicking Control-O and selecting the dataset from a shared network drive or internet source. Any editing is then done, before the dataset is re-saved to the previous location. To access the information, a network link is generated. This is done by selecting Add Network Link from the Add menu in the menu bar at the top of the screen. In the dialog box that appears, the pathway to the file is included in the Link box. This network link can then be saved independently and shared to various users via email or by posting it to an intranet or shared server. When the users open the network link, they will immediately have access to the dataset.

ANALYTICAL USES

While it can take a considerable amount of time to initially generate a dataset, once it has been generated and proper procedures have been developed for incorporating new data it can prove to be a very useful analytical tool.

Many of the previously mentioned law enforcement functions can be significantly enhanced by employing a robust dataset in Google Earth. For example, simply marking and tracking the locations of arrests or crimes can be used to adjust patrol routes to ensure that they pass through areas with a significant amount of activity. In this instance, proper use of Google Earth and a developed dataset can eventually serve as a deterrent to criminal activity.

Likewise, a developed dataset can allow a law enforcement organization to properly allocate resources in a region, ensuring that high-crime areas have the necessary resources to adequately serve the public. This is a prime example of the financial benefit of geospatial information technology.

Counterdrug Operations

One aspect of law enforcement where GIS technologies such as Google Earth can be effective is in counterdrug operations. Using the aforementioned techniques, locations of drug-related arrests or locations of drug-related points of entry or facilities can be tracked.

Consider the following image. Assuming that the marked locations are distribution points of drugs entering the United States from Mexico, a host of analytical options can be described.
Once locations are known and marked, various options are available for analysis. The most obvious involves discerning potential routes of travel for distribution. Simple analysis can be performed, asking questions such as "do they travel at night" or "are they using heavy or light vehicles". Knowing when and how drugs are being transported can serve to more accurately identify potential routes of travel. Light vehicles may be more likely to make use of minor or even unpaved roadways in a given region, which are often patrolled far less frequently. Being able to exploit a gods-eye view of the area can often help to make such analytical decisions easier to understand.

Furthermore, being able to visually observe drug-related activity in a program such as Google Earth can aid in the identification of distribution facilities or production centers. When a number of drug-related arrests, particularly those involving the sale of controlled substances, are marked in a given area, analysis can be performed on the dataset to identify likely distribution centers. One such method can be to determine the facilities relatively equidistant from each arrest, and marking them for further investigation. Other intelligence sources can also be used in combination with the available data to effectively analyze the overall picture in a given area or region.

Gang Activity

Gang activity can also be evaluated using Google Earth. A previous image depicted two notional gang territories in Phoenix. Simply marking such regions can be a useful endeavor. Areas where two or more territories abut against one another can be potentially volatile regions. A logical use for this data would be to manage patrols in the area to forestall any violent action to a degree.

Territories themselves can be evaluated and marked using analysis of gang symbology in a region. A previous example depicted an image of gang symbology inserted into the dialog box associated with a placemark. Marking these occurrences in Google Earth can serve as a way of identifying the breadth of a particular gang's territory. Furthermore, an officer or agent assigned to a particular area can exploit such a placemark as a reference source on the potential symbology associated with a region. Then, if a different set of symbology is discovered, gang territories can be updated accordingly. This can aid in the understanding of the fluidity of territories in some areas.

Border Security

One of the most critical problems facing law enforcement agencies in some areas is border security. A three dimensional viewer such as Google Earth can be an effective tool in evaluating and combating border incursions.

Having three dimensional terrain to evlauate can often provide insight into potential routes of ingress by illegal aliens. Being able to visualize the terrain in a region can aid law enforcement agencies in discerning how illegals manage to cross the border unobserved. Often, terrain can be exploited by these criminal groups to mask their presence from population centers in a given region. The analyst need simply ask the question "where can they be hidden from view" to discover potential ingress routes which may not have been apparent simply by examining a two dimensional map of the area.

Such analysis can also aid in other areas, such as discovering border crossing zones where illegal substances are brought into the nation. While these techniques alone will not necessarily identify these areas conclusively, they can certainly aid in developing a starting point for any investigation.

CONCLUSION

Google Earth by itself is not going to put an end to crime in America. Nor should it be used as the sole source or method for performing analysis and evaluating potential courses of action by any law enforcement agency. However, it can clearly be seen that effective analysis coupled with a robust set of data to evaluate can most definitely have benefits to any law enforcement agency. Law enforcement agencies would certainly benefit from proper exploitation of this freely available resource.

SOURCES

-Satellite imagery provided courtesy of Google Earth

Wednesday, July 9, 2008

DNI Open Source Conference

I have been asked to advertise the fact that the Office of the DNI will be hosting an open source conference on 11 and 12 September this year. This is basically a way for intelligence consumers to discover a lot of the open source intelligence sources that are available, and learn how to effectively employ them. The event is open to the public provided you register in advance, and is obviously of great benefit to intelligence consumers in both academic and professional career fields. Anyone interested in attending must register by 31 July. Registration has to be done online at the link provided below.

Download a fact sheet on the conference here.

Visit the DNI's Open Source Conference 2008 website to register.

For an idea of the kinds of information on offer, you can view the presentations made at the 2007 conference at the following link: 2007 DNI Conference Sessions

Certainly sounds like a very interesting event. Unfortunately I won't be able to attend this year because of professional obligations, but this is something I'll definitely keep my eye out for in the future!

Saturday, January 5, 2008

US Restricted and Classified Test Sites

INTRODUCTION

The widespread availability of open-source overhead imagery thanks to applications like Google Earth and NASA World Wind has provided the public with the chance to view many restricted and classified test locations within the United States. While details of the test programs associated with some of these facilities are obviously not going to be discernable, the availability of open-source imagery nevertheless allows individuals to view sensitive facilities that normally would be hidden by terrain, and sometimes heavy security.

This article is not intended to be an all-inclusive list of classified test facilities, nor an in-depth examination of Area 51, but rather an overview of some of the most significant and interesting test sites in the country.

RCS RANGES

Some of the most significant defense-related facilities in the United States are Radar Cross Section (RCS) test ranges. These facilities, being either contractor or government operated, conduct some of the most sensitive test programs in the defense industry. RCS ranges are used to test the radar signatures of various objects, most significantly with the aim of measuring their ability to evade radar detection against various radar types. Stealth platforms like the HAVE BLUE were tested at an RCS range in order to validate the design before flight testing, for example, to ensure that the RCS of the aircraft would meet the requirements of the test program. Due to the sensitive nature of the testing conducted at these facilities, they are typically located in isolated areas.

The primary outdoor RCS test ranges can be located at the following coordinates:

Boardman: 45°44'53.55"N 119°47'10.02"W
Grey Butte: 34°34'13.01"N 117°40'11.27"W
Helendale: 34°49'30.40"N 117°17'45.83"W
Junction Ranch: 36°02'15.81"N 117°30'10.69"W
Kirtland AFB: 34°57'33.77"N 106°29'59.27"W
RATSCAT: 33°10'59.71"N 106°34'23.81"W
Tejon: 34°55'27.49"N 118°31'44.76"W

The following image depicts the relative locations of the various outdoor RCS test ranges listed above:


Boardman

Located in an isolated area west of Boardman, Oregon, the Boardman RCS range is owned and operated by Boeing. The facility consists of a radar array at the west end and a pylon for mounting test articles at the east end. The pylon can be covered by a large, moveable hangar, to protect sensitive test objects from view. When RCS testing is ongoing, the hangar slides out of the field of view of the radar sensors on a set of rails. The sliding shelter concept is similar to what was used at the former Grey Butte RCS test range.

The following image depicts the Boeing Boardman RCS test range:


Grey Butte

The former Grey Butte RCS test range is located 25 miles south by southeast of Edwards AFB in California. The Grey Butte facility was operated by McDonnell Douglas in the past, before being acquired by Boeing when the two companies merged. In 1999 the facility was closed down, being sold to General Atomics, who currently uses the facility to conduct UAV research. The former RCS test range consisted of a primary antenna array at the west end, with various target positions scattered around the range. The primary RCS test article position was directly east of the antenna array, and was hidden by a retractable hangar, which may have inspired Boeing to use a similar system at their Boardman facility.

The Grey Butte facility is interesting insofar as the location of the aforementioned retractable hangar is concerned. At the Boardman facility, the hangar retracts southeast to place the structure outside the field of view of the radar being used to measure the test article's signature. In the Grey Butte facility, the hangar retracted directly aft of the test article's location. This is interesting because it would seem to indicate that the hangar was still within the field of view of the radar arrays targeting the test article. There are two possible explanations for this apparent discrepancy. First, radar sets with a very narrow beamwidth may have been employed. This would have allowed them to target the RCS test article, with any extraneous radar energy simply passing it by and travelling straight through the open hangar bay. The second possibility is more abstract, and far less likely, although it does raise some interesting questions. It is known that the Russian defense industry has been experimenting with ionized plasma as an RCS-reduction method. A similar system (or some other RCS-reduction method) could, in theory, have been employed at Grey Butte to hide the hangar structure.

The following annotated image depicts the former Grey Butte RCS test range:


Helendale

Lockheed Martin's Helendale RCS test range, situated 32 miles east by southeast of Edwards AFB, is one of the most storied RCS test ranges in the country. The range area consists of an antenna array at the southern end, with two secondary target positions situated 425 meters and 1520 meters downrange. The primary test article facility is a large structure situated 2300 meters from the radar array. This is a large, underground complex, with a sliding roof hiding the retractable primary test pylon. A mobile radar antenna is also present, which moves off to the west when not in use to allow the radar sensors to the south a clear field of view to measure the primary test article.

The following annotated image depicts Lockheed-Martin's Helendale RCS test range:


Tejon

The Tejon RCS test range is owned and operated by Northrop-Grumman (previously Northrop, before the merger). Located 35 miles west of Edwards AFB, the Tejon RCS range consists of two separate, co-located facilities. The older, larger north complex features an antenna array and four target positions, while the newer south complex features two separate antenna-target combinations.

The following annotated image depicts Northrop-Grumman's Tejon RCS test range:


Not all RCS test ranges are operated by private contractors. The US DoD operates three outdoor RCS test ranges in California and New Mexico.

Junction Ranch

The Junction Ranch RCS test range is operated by the US Navy. It is situated on the massive China Lake range complex, located 27 miles north by northeast of China Lake NWC.

The following annotated image provides an overview of the USN's Junction Ranch RCS test range:


Being a US Navy complex, the Junction Ranch RCS range has a few unique features. Firstly, there are two separate test sites. The "dry" site is a conventional RCS test range employing a radar array and pole-mounted test objects.

The following annotated image depicts the "dry" RCS test range at Junction Ranch:


The second range is unique in that it is a "wet" facility, designed to test replicas of seagoing objects which are mounted in a water pool. Three miles to the southeast a radar facility is located atop the surrounding mountains to enable RCS testing of objects placed in the pool. Both of these locations are depicted in the overview image above.

RATSCAT

The RATSCAT Advanced Measurement System (RAMS) site is located 35 miles northwest of Holloman AFB, New Mexico. RAMS represents the most advanced low-RCS test range in the country, and as such is isolated in the White Sands Missile Range. Holloman AFB is also home to various other RCS test facilities operating under the direction of the National RCS Test Facility, with the capability to measure both pole models and in-flight models or aircraft.

The following image depicts the RATSCAT Advanced Measurement System site:


Kirtland AFB

Kirtland AFB in Albuquerqe, New Mexico is also the home to an unidentified RCS test facility. Some sources indicate that the facility may be associated with the Sandia National Laboratory, which also operates some facilities on the Kirtland range.

The following image depicts the RCS test range located on the Kirtland AFB range:


There are two other significant outdoor RCS facilities visible in the United States. They are associated with one of the most secretive military installations on the planet.

AREA 51

Area 51, also known as Groom Lake, Watertown Strip, Dreamland, or The Ranch, is one of the US government's most highly classified test facilities. The activities which take place at Area 51 are some of the military's most sensitive test programs, and have included the flight testing of the U-2, the A-12, and the HAVE BLUE stealth technology demonstrator.

The following image provides an overview of the expansive Area 51 complex:


Area 51 is home to some unique structures, both historical and current. The original AQUATONE and OXCART hangars can still be seen, with the OXCART hangars likely having served as the home to the RED HAT aircraft. The 24,000 foot runway, the longest in the world, is still present as well, but this is believed to no logner be operational, as denoted by the X markings on the northern end and the fact that the new runway uses the same numbers.

The following annotated image depicts some of the most interesting and significant facilities located at Area 51:


Various test facilities are located at Area 51. The location where the A-12 was pole-mounted for RCS testing can still be seen adjacent to the lakebed's western edge. The DYCOMS radar sensor system can also be seen. DYCOMS is an airborne RCS test system used to evaluate the radar signatures of aircraft which overfly the facility.

The following annotated image depicts Area 51's DYCOMS RCS test facility:


A facility which has been referred to as the QUICK KILL radar site is also present adjacent to the DYCOMS facility. The terminology may indicate that this is an electromagnetic weapon of some sort, designed to disable electronic systems.

Area 51 is not the only significant test site in the Nevada Desert. Some of them, by nature, may even be more secretive.

TONOPAH ELECTRONIC COMBAT RANGE

Located near Tonopah Test Range, the former home of the then-classified SENIOR TREND fleet, is an expansive complex housing what may be some of the most secretive items in the United States. A vast electronic combat range containing numerous radar systems is home to more than a few examples of Soviet and Russian radar systems. While their presence may be an open secret, as it has been stated in the past that the OXCART was tested against Soviet radar systems, the means of their acquisition is understandably highly classified. One can speculate that some systems may have been sourced from cash-strapped former Soviet republics, in the same manner that Moldova's MiG-29 fleet was acquired.

The following annotated image provides an overview of the most prominent features of the Tonopah Electronic Combat Range:


Not all of the radar systems present at the Tonopah site can be identified, due to the resolution of the imagery, and some of them may not even be radar systems at all. However, some of the radars are readily identifiable due to their large size. Situated around what appears to be the primary facility are four raised berms, each appearing to house a radar system. The northern and eastern berms are home to Soviet-era P-35 (BAR LOCK) E/F band EW radars. Just south of the main facility is another pad which appears to house an RSN-125 (LOW BLOW) engagement radar associated with the S-125 (SA-3 GOA) SAM system.

The following annotated image depicts the main test area at the Tonopah Electronic Combat Range:


TOLICHA PEAK ELECTRONIC COMBAT RANGE

The radar range near Tonopah is not the only electronic combat facility in the Nevada desert. At 37°18'58.48"N 116°46'50.93"W the Tolicha Peak Electronic Combat Range can be found.

The following annotated image provides an overview of the most prominent features of the Tolicha Peak Electronic Combat Range:


The mainstream belief is that the Tolicha Peak facility houses numerous radar systems to support RED FLAG operations, given its proximity to two mock airfields. A more detailed examination provides an alternative, that of foreign SAM system exploitation and testing. Elements of S-125 (SA-3 GOA), S-200 (SA-5 GAMMON), and S-300PS (SA-10B GRUMBLE) SAM systems can be found on the grounds of Tolicha Peak.

The following annotated image depicts what is likely an S-125 facility at Tolicha Peak. The object to the west of the RSN-125 (LOW BLOW) radar system would appear to be some sort of three-round launcher, or an unusual radar system, and does not resemble the 5P71 or 5P73 launchers found at operational S-125 sites around the globe, and as such may be some sort of dedicated test equipment.


The following annotated image depicts an S-200 launch site at Tolicha Peak. There would appear to be a second missile, albeit with the control surfaces removed, nearby. The 5N62 (SQUARE PAIR) engagement radar is not colocated with the launch facility and was not readily identified, but the facility 0.47 kilometers to the southwest is a candidate.


The most interesting facility found at Tolicha Peak is the S-300P launch site. It would appear that a nearly complete collection of radars is present, as well as two TELs and a 40V6 mast assembly. The 40V6 is used to mount either the 5N63S (FLAP LID) engagement radar or the 76N6 (CLAM SHELL) low altitude detection radar on a 23.8 meter mast to provide better performance in areas with varied terrain or vegetation. The shadow cast by the southern 5P85 TEL seems to indicate that it is a 5P85S, complete with the control compartment for controlling the adjacent 5P85D TEL. The vehicle which is most likely the 5N63S engagement radar vehicle appears to have the radar array lowered in the travel configuration. Given the presence of the mobile TELs and the mobile 5N63S radar, the system present here is likely either an S-300PS or export-standard S-300PMU.

The following annotated image depicts the Tolicha Peak S-300PS facility:


Close examination of the terrain in the vicinity of the Tolicha Peak Electronic Combat Range would seem to display impact craters, providing further evidence that actual SAM firings may be taking place here. As the United States does not actively list any of the aforementioned SAM systems in its operational inventory, it is likely that some sort of test work does take place here. It is also possible that the associated radar systems are in fact also used against aircraft flying on the Nellis AFB Range to provide more realistic electronic combat training.

JACKASS FLATS

Jackass Flats is situated 45 miles southeast of the Tolicha Peak Electronic Combat Range, and was the home to some of the most interesting experimental programs to be conducted in the Nevada desert.

Pluto

Located on the eastern portion of Jackass Flats is the remains of one of the most interesting and potentially catastrophically dangerous weapons programs of the Cold War. Project Pluto was intended to culminate with the development of a nuclear powered cruise missile. A facility was constructed to test conceptual nuclear engine designs for Project Pluto. The vast facility consisted of three main areas. Firstly, there was a reactor assembly building where the Tory-series reactors were constructed and then disassembled for analysis post-firing. Secondly, there was a separate reactor test facility situated 2 miles from the assembly facility, where the test firings would occur. Lastly, there was a complex consisting of 25 miles of piping designed to provide the compressed air necessary for testing the reactor, as it was intended to operate as a ramjet and could not function with still air. Current imagery indicates that the piping has since been removed, but the structures remain, as does the railway which used an automated railcar to transport the test articles between the two facilities.

The following annotated image depicts the Project Pluto facilities at Jackass Flats:


HENRE

Jackass Flats was home to a second nuclear-related test. The High Energy Neutron Reaction Experiment (HENRE) program used a linear accelerator to provide neutrons which would be used in a radiation measurement test program. The 1,527 foot tower used in the HENRE program was previously a resident of the Yucca Flat test area, and was employed in the BREN program. It was relocated to Jackass Flats to support the HENRE program in 1966.

The following image depicts the HENRE test tower at Jackass Flats:


NRDS

The Nuclear Rocket Development Site (NRDS) at Jackass Flats was used to test nuclear rocket engines under the auspices of various test programs. The facility consisted of numerous structures, including the Reactor Maintenance, Assembly, and Disassembly (R-MAD) and Engine Maintenance, Assembly, and Disassembly (E-MAD) stations. There were three test stands, Test Cell A, Test Cell C, and Engine Test Stand 1 (ETS-1). Rocket engines, much like those tested at the Pluto facility, were transported using an automated rail system.

The following annotated image provides an overview of the NRDS:


Test Cell A was the location for the Kiwi-TNT destructive test which consisted of the obliteration of a nuclear rocket engine to simulate a potential accident during launch of a nuclear-powered rocket.

The following annotated image depicts one of the engine transportation railcars remaining at the E-MAD facility:


SOURCES

Radar Ranges of the Mojave
Gray Butte Radar Cross-Section Facility
Building Map of Area 51
RCS Ranges
The HENRE Program
Project Pluto
The NRDS (PDF file)
More on the NRDS (PDF file)

-All overhead imagery provided courtesy of Google Earth, Microsoft Virtual Earth, and NASA World Wind. USGS imagery was provided by the latter two sources.

-All information contained in this article is sourced from the public domain, principally the World Wide Web, and is not intended to imply the dissemination of, nor does it contain, restricted or classified material.

-For more information on NASA's World Wind application, reference the following: LINK

Sunday, July 8, 2007

IMINT & Google Earth

One of the most fascinating applications available on the internet is Google Earth, an open-source satellite imagery browser allowing the user to navigate to any point in the globe and view satellite or overhead imagery of that location. Many kinds of analysis can be performed using Google Earth, but unfortunately the program needs a little work before any significant military analysis can be conducted.

There are three main issues with using Google Earth as an analysis tool for military intelligence information: resolution, timeliness, and coverage.

The first issue is one of resolution. There are varying levels of resolution to be found in Google Earth. Most of the lower resolution areas have a resolution of 15 meters. SPOT imagery has been incorporated in some areas, such as France, bringing the resolution down to the 2.5 meter mark. This is still not sufficient for any sort of analysis. For detailed analysis, resolution of at least 1 meter is necessary in order to accurately identify military equipment. Digital Globe imagery provides 0.7 meter resolution in many areas, and the highest resolution available is 1 inch, although this is only found in select areas. Some facilities such as Russian BMEW radars or SA-5 GAMMON sites can be discerned in the 15 meter imagery, but anything on a smaller scale will go unnoticed. The reason resolution is critical is because smaller objects such as aircraft and SAM systems must be able to be identified. Apart from general layout, one of the easiest ways to do this is to simply measure the object. This is how one can tell the difference between an S-300PM and an S-300PM-1, for example. The S-300PM TELs measure in at approximately 43 feet, where the S-300PM-1 TELs are roughly 4 feet longer. Without decent enough resolution, it is nearly impossible to get an accurate measurement; shadowing, adjacent objects, and other errata cannot be adequately discerned and discounted.

The second issue is timeliness. Effective analysis of a military facility requires a comparitive analysis over a period of time to discern deployment patterns, ORBAT changes, and gather an accurate estimate of equipment on strength. The best illustration of this is an analysis of the naval ORBAT at a given port facility. At the time the image was taken, any number of vessels may be out of port and therefore not depicted. Google does sometimes update the coverage of various areas, but more often they are likely to update areas not previously visible in high-resolution. This presents an analyst with a problem, as he or she will not be able to perform comparitive analysis. Also, if the imagery visible is more than a few months old, wholesale changes in the facility's ORBAT may have occurred. For a while, Langley AFB only depicted F-15C Eagles on the flightline, when it was known that the F-22A Raptor was on-station in substantial numbers. Furthermore, current imagery depicts a barren flightline, the image being taken when the associated units were off-station while runway maintenance was being accomplished. This work was finished months ago, yet the imagery does not depict any operational aircraft on-station. All of this can cause an analyst to misrepresent a facility's ORBAT.

The final issue is coverage itself. Google Earth suffers from a lack of high-resolution data in many areas. In some areas, such as around Moscow, high-resolution coverage is relatively spotty in places, making analysis of known facilities such as Zhukovskiy flight test center impossible. If there is not adequate high-resolution coverage of an area of interest, a complete analysis of that area is impossible. To cite an example, one must only look near Engels AB in Russia. There is an S-300P SAM garrison nearby, but an analysis of the air defense picture is not possible as the lack of sufficient high-resolution data has so far precluded the location of any active or even inactive S-300P SAM sites. They are most definitely in the area, as evidenced by the presence of the garrison, but they are not visible in the available imagery. Simply assuming that they are located within the boundaries of nearby low-resolution areas is not sufficient; a few tens of kilometers of difference in site placement can result in a perceived gap existing in the air defense network where there may be no gap at all.

It should be stated that none of these constraints are meant to be construed as negative aspects of the program itself. They merely illustrate the limited usefulness of the software and the associated geospatial data in military analysis. This is not to say that military analysis cannot or should not be conducted at all, far from it. But it must be understood that the accuracy and scope of any such analysis will be limited by the constraints imposed by the program itself.

Monday, May 7, 2007

National Security and Open-source Imagery

INTRODUCTION
In the 21st Century one of the most fascinating new mediums being explored on a large-scale level is that of overhead imagery. Satellite imagery was once tucked away securely in the realms of the military and of the scientific community. With new applications such as Google’s Google Earth and Microsoft’s Windows Local Live, overhead imagery is becoming ever more prevalent in the civilian sector. In today’s terrorism-conscious world the obvious concern is one of national security, a concern which has proven to be unfounded.

OPEN SOURCE IMAGERY
Open source imagery has become a common tool for many individuals. Overhead imagery has a myriad of uses in the private sector, ranging from business applications such as real estate to administrative applications such as land zoning. Overhead satellite imagery has been made available free to the general public at numerous locations on the internet, from Global Security’s Image of the Week[1] to the National Geospatial-Intelligence Agency’s Raster Roam site.[2] Perhaps the most significant development in the realm of open source imagery has been Google’s release of Google Earth, a free software application allowing users to browse a worldwide database of overhead imagery.

Google Earth is the benchmark in today’s overhead imagery scene. The ease of use of the application allows users to view any point on the globe with ease. Points of interest can be placemarked, and placemark files can be shared with other users on the internet by inserting them into Google Earth’s placemark database. Google Earth has recently begun to see use in the mainstream media. FoxNews commonly uses Google Earth to depict the locations of news stories. Various corporations are beginning to see the value of the application as well. Frank Taylor’s Google Earth Blog constantly chronicles new industry uses of Google Earth, as well as significant updates to the imagery server or the software itself.[3]

The most common method of exploitation is to devise a series of placemarks for a given area and share them with potential clients or interested parties via a website. This particular usage is beginning to see widespread use in the field of real estate, allowing potential buyers to get a birds-eye view of the property in question and view the surrounding area. With Google Earth’s incorporation of placemark databases containing schools, restaurants, and other necessities, a fair assessment of a potential community can be made without ever leaving the home.

While Google Earth is a valuable and powerful imagery exploitation tool, it is limited in select areas. Most significantly, the high-resolution imagery database is incomplete and as such constantly updated. While the entire globe is visible in at least 15 meter resolution, this is insufficient for detailed examination of most locations. The highest resolution available is 15 centimeters in select locations such as Las Vegas, with most other high-resolution areas falling around the 1 meter range.[4] The problem is that there are many areas of potential interest that do not yet contain high-resolution imagery. Other high-resolution areas are sometimes updated with more current imagery, potentially causing various placemarks to become invalid.

In order to obtain open-source imagery of the desired resolution, a user may choose to obtain such imagery from a paid source such as Digital Globe. This method ensures that the user will end up with the desired imagery at the desired resolution. The only limitations are the price, and the time it can take to collect the imagery if it does not already exist in a database.

THE BASRA QUESTION
On the 13th of January, 2007, The Telegraph reported that insurgents operating in Basra in southern Iraq appeared to have been using Google Earth to pinpoint British troop locations to conduct terrorist attacks.[5] This incident appeared to represent a potential problem with public access to overhead imagery. The reality is far from serious.

In order for the extremists to have made use of Google Earth imagery effectively, it must have been current. The imagery of downtown Basra currently available in Google Earth was taken in 2002. Imagery dates can be verified by viewing the Digital Globe coverage areas within Google Earth and clicking on the placemarks denoting the collection date. At first glance, there would appear to have been imagery of Basra taken as late as 2006. However, closer examination shows that this imagery was not incorporated into the Google database, as the snapshot view depicts extreme cloud cover over the area. Google Earth does source a good deal of imagery from Digital Globe, but every image taken is not necessarily incorporated into the database. Ergo, any current imagery in Google Earth would not have assisted extremists in Basra in locating British forces. The following image taken from Google Earth depicts the current view of the Basra Palace. No British troops would appear to be in residence.

The Telegraph asserts that extremists had printouts of Google Earth imagery depicting British forces in Basrah Palace.[6]
While the imagery in the database does not depict any occupation at the palace, there are two other points to be considered. First, external imagery from sources such as Digital Globe, Global Security, or Terra Server can be incorporated as an overlay into Google Earth. Just because the imagery was taken from Google Earth, it therefore did not necessarily source from Google Earth. Secondly, The Telegraph has alleged that Google Earth has “blotted out” certain areas where sensitive British military operations are conducted. These areas include Hereford, home to the British Special Air Services commandos, and Faslane, home to the UK’s Trident submarine strategic nuclear deterrent force.[7]

Unfortunately, The Telegraph’s explanation does not wash. Simply put, Hereford and Faslane were never in anything other than 10-15 meter resolution to begin with. After reading many of Patrick Robinson’s novels, the author became enamored with Faslane and was on the lookout for a high-resolution update to contain the submarine base. That update has, to date, still not happened. It is possible that Google “rolled back” their coverage in Basra to an earlier date to remove evidence of British occupation of the city. The surrounding area includes Basra International Airport. There are various placemarks visible for British combat aircraft which are no longer visible, suggesting that an imagery change did in fact take place. The following image taken from Google Earth depicts a parking ramp at Basra International Airport. The placemark for an RAF C-130 Hercules aircraft can be seen, clearly showing that the imagery has been changed at some point.


NATIONAL SECURITY CONCERNS OF OPEN SOURCE IMAGERY
The Basra incident highlights one of the chief concerns of public access to high-resolution overhead imagery: such imagery may enable terrorist or military forces to gain an advantage over an enemy. There are a myriad of military installations and targets which are visible in overhead imagery, particularly in Google Earth. The question therefore becomes whether the ability to access such imagery is a serious threat to the national security of a nation being imaged.

There are two different aggressors which should be considered: terrorists and nation-states. Terrorists and other insurgent groups would seem to have the most to benefit from having access to overhead imagery. Nation-states would not, for the most part, need to rely on open-source imagery for intelligence, as they would enjoy access to a multitude of other intelligence sources.

In order for a terrorist to make use of overhead imagery, the imagery must be current, it must depict the target in sufficient resolution to be of value to a potential operation, and it must be available. Overhead imagery from a plethora of sources fits these requirements, particularly availability; there is nothing stopping a terrorist from accessing Google Earth or ordering imagery from Digital Globe. However, the question is whether or not that imagery provides the extremist group with a particular advantage or ability that they would not have otherwise enjoyed. The answer is a resounding no.

Extremists employ various methods of attack, including car bombings, improvised explosive devices, and hit-and-run tactics. None of these tactics would gain any significant advantage if overhead imagery was available. However, mortar and rocket attacks would seem to benefit. Possessing overhead imagery would allow for more accurate targeting as target locations could be more accurately measured. The problem with this argument is that rocket and mortar systems are unguided and inherently inaccurate to begin with. Were guided weapons employed, the added accuracy could in theory be of a tactical benefit. With an unguided weapon, however, the added knowledge gained from analyzing overhead imagery is not as useful.

The idea of terrorists being able to gain more detailed knowledge of target areas is also in question. Many Coalition bases in Iraq, for example, possess native Iraqi workforces. Intelligence on troop and facility locations can be gleaned from these individuals by extremist groups. Also, any street map will provide a good deal of information regarding the potential locations of facilities. With careful observation and a good street map, an insurgent in Basra could accurately map out troop and facility locations. Ergo, overhead imagery is not necessarily needed. While it would seemingly negate the need for a period of observation, it does not provide an insurgent group with anything they cannot obtain for themselves.

A nation-state presents a whole new argument. While the insurgent group may concern itself with simple targets such as troop concentrations or bases, the nation-state may desire to be far more detailed in its targeting. Examples of potential targets include surface to air missile (SAM) sites, nuclear weapon facilities, and naval bases.

The key to gaining intelligence of any value from open source overhead imagery lies in the detail of the imagery itself. Consider the following scenario: a Turkish combat aircraft is tasked with striking a naval vessel leaving Sevastopol which is going to deliver military equipment to Greek Cypriot forces on Cyprus. The primary static threat to a strike aircraft comes from early warning systems and SAM sites. Once again, imagery in Google Earth can be considered a likely source of open source imagery for the area as Sevastopol is imaged in high-resolution. The problem becomes one of system identification. Defending Sevastopol, there are three active SAM sites that can be identified. Due to the nature of the imagery, they can be identified as Russian-made Almaz S-300P family systems. This is where the problem lies. Further east near Alushta, there is an S-300PT which can be identified. The S-300PT is an early-model S-300P system with a range of 47 kilometers.[8] The problem lies with the other three sites: they cannot be positively identified as anything other than generic S-300Ps due to the similarities between the remaining variants. The S-300P family contains missiles ranging from 47 to 200 kilometers; while the systems can be broadly classified as S-300PM or S-300PM-1 variants due to the length of the TELs, this does not provide insight into what missiles are being employed.[9] Knowing which system an aircraft will face is an integral part of the mission planning process; it will dictate the route to be taken, the sortie profile, and in most cases the weapon to be employed. If shorter-range systems were present, then perhaps a standoff weapon would be used in the attack. This scenario highlights the value of a military-grade imagery intelligence capability, as well as the value of other intelligence sources such as Electronic Intelligence (ELINT) in conducting a study of a potential target area. Commercial overhead imagery is therefore not particularly valuable to a nation state as a source of intelligence.

There is another reason why open source imagery is not typically valuable to a nation-state. Overhead imagery typically contains a snapshot of a particular moment in time. There are numerous SAM sites, for example, visible worldwide using Google Earth. Many of these sites were unoccupied at the time they were imaged. However, many modern SAM systems such as the S-300P are mobile systems and can easily be relocated. Relying on a commercial image obtained at some point in the past does not therefore necessarily provide a current view of an enemy’s defensive network. Most military intelligence gathering organizations will have the capability to gather near real-time imagery of a potential target area, providing a much more current picture of an enemy’s forces in the area. A further example would be that of naval facilities. While a snapshot of Litsa Guba may show four Typhoon-class SSBNs in residence, there is no guarantee that the submarines are actually in-residence given the timing of the image acquisition.

There is one more potential national security concern with open source imagery. While open source imagery has been shown to not present an aggressor with an advantage other than convenience, this concern is far more serious. Many areas inside the United States and the rest of the world are becoming visible to the general public for the first time. There is the chance that sensitive or classified activities may be uncovered. At first glance, this would seem to be mildly ludicrous. Take the example of Area 51 in the United States. Area 51 has long since been mooted as the home of classified aerospace-related test activity. Area 51 is also visible in Google Earth in high resolution. While there are F-16s and 737s visible on the tarmac, no “black jets” are anywhere to be seen. The reason, provided the aircraft were present to begin with, is that satellite orbits can be tracked. During the Cold War it was common practice for test aircraft to be concealed from view when Soviet satellites were known to be overhead. This practice does not mean, however, that evidence of sensitive or classified activity cannot be discerned using open-source imagery.


The preceding image captured in Google Earth depicts a fenced in facility outside of El Paso, Texas, set half a mile off of Route 180. At first glance, this appears to be a benign military facility. Closer examination, however, reveals something far more sensitive. Visible inside the facility are a plethora of foreign weapon systems, including Russian-made SA-6 and SA-11 SAM systems. America’s possession of foreign weapon systems is nothing new or sensitive. The acquisition of Moldovan MiG-29s in the 1990s was well publicized, for example. This facility would appear to be something of an enigma, however, as there is no reference in any open source publication to American acquisition of an SA-11 SAM system. The logical assumption is that this facility is related to the exploitation of foreign weapon systems. Given that the US Army’s Air Defense School is located in nearby El Paso at Fort Bliss, this would seem to be a sensible location for SAM system exploitation given the large range areas that Fort Bliss contains. This activity in itself is not necessarily sensitive, but the mention of an SA-11 in the United States could be enough to cause a foreign power to investigate how exactly it was obtained, potentially leading to a future problem should it turn out to have been covertly acquired. That being said, once again image resolution comes into play here. Without closer examination, either on-site or through very high resolution imagery, the systems in the El Paso facility cannot be positively identified as actual hardware; they could merely be decoys used for training purposes or as range targets. This does not alleviate the concern that national security could be threatened by a knowledgeable interpreter armed with the right set of imagery to work from.

The news media can also be a source of concern. In 2001, the United States was gearing up to begin Operation ENDURING FREEDOM. The author was stationed at Al Udeid air base in Qatar in March of 2002 to support this effort. The location was classified until a March 2003 visit by the Vice President led to the announcement of the location by the news media. Prior to this, however, the news media reported in January 2002 that Global Security had obtained satellite imagery of the airbase from Digital Globe.[10] This was a clear breach of security, and could have led to disastrous results. A Middle Eastern insurgent group, or even a nation state like Iraq, could have chosen to strike the airbase, whereas they may not have been aware of the facility had the news media not plastered satellite imagery of Al Udeid all over their networks.

GOVERNMENT RESPONSE OPTIONS
Open source imagery does not appear to present a serious risk to any nation’s security. However, if open source imagery is regarded as a threat to national security, the government being imaged does have a number of options to alleviate its concerns.

First, the government can take steps to ensure that sensitive activities are concealed from satellite view by studying satellite over flight patterns. As mentioned before, this was a technique employed by the United States during the Cold War.

Secondly, the government can request that imagery providers such as Digital Globe or Google Earth do not release imagery or reduce the image quality of sensitive areas such as military installations or nuclear facilities. In Google Earth, for example, the NATO AWACS base at Geilenkirchen, Germany is pixellated, precluding any viewing of the airbase or its contents. This sort of request may have led to the rolling back of imagery near Basra in Google Earth, as was previously discussed.

Thirdly, nation states could enact laws restricting the publication of imagery depicting military facilities or military operations without prior approval. While this would likely meet with public disapproval, if the nation state does perceive such imagery to be a national security concern, then this would appear to be a logical course of action.

CONCLUSION
Open source overhead imagery is a fascinating tool for professionals and enthusiasts alike. While there are certain national security concerns over the public availability of overhead imagery, the concern is for the most part unfounded. Restricting access to overhead imagery will not deter either terrorist groups or nation states from using violence to achieve their goals, nor will it prevent them from using other means to gather vital intelligence information. Given the characteristics of the imagery and the overall global situations into which it is injected by the media, the only possible conclusion is that the public availability of open source overhead imagery is not a serious national security concern, nor does it provide terrorist groups with a significant advantage in terms of planning and carrying out attacks. In all actuality, the presence of publicly available imagery might be a deterrent in some cases. Either way, overhead imagery is here to stay, and as a whole the world is better off for it thanks to the numerous civilian, scientific, and commercial uses it provides.

[1] Available online at http://www.globalsecurity.org/eye/index.html; recent updates appear to be on a less than weekly basis, unfortunately.
[2] Available online at http://geoengine.nga.mil/geospatial/SW_TOOLS/NIMAMUSE/webinter/rast_roam.html
[3] Available online at http://www.gearthblog.com/
[4] Online source available at: http://earth.google.com/coverage/coverage_list.pdf
[5] Online source available at: http://www.telegraph.co.uk/news/main.jhtml?xml=/news/2007/01/13/wgoogle13.xml
[6] Online source available at: http://www.telegraph.co.uk/news/main.jhtml?xml=/news/2007/01/13/wgoogle13.xml
[7] Online source available at: http://www.telegraph.co.uk/news/main.jhtml?xml=/news/2007/01/20/wgoogle20.xml
[8] James C. O’Halloran, ed., Jane’s Land Based Air Defense, 15th edition (Surrey: Jane’s Information Group Limited, 2002), 148-150.
[9] Ibid.
[10] http://www.globalsecurity.org/military/facility/udeid.htm